You can’t walk every row, every week. We fly your fields with precision drones and turn what we see into decisions — before a small problem becomes a yield problem.

A weed patch in the middle of a 30-hectare field. A pivot nozzle spraying the wrong pattern for three weeks straight. A section of the field running behind on vigor for reasons nobody noticed. None of these show up from the farm road — and by the time they do, the yield is already gone.
Ground scouting covers a fraction of a field, a few times a season
Problems in the interior of a pivot or a back corner go unseen for weeks
Decisions get made on guesswork instead of what’s actually growing
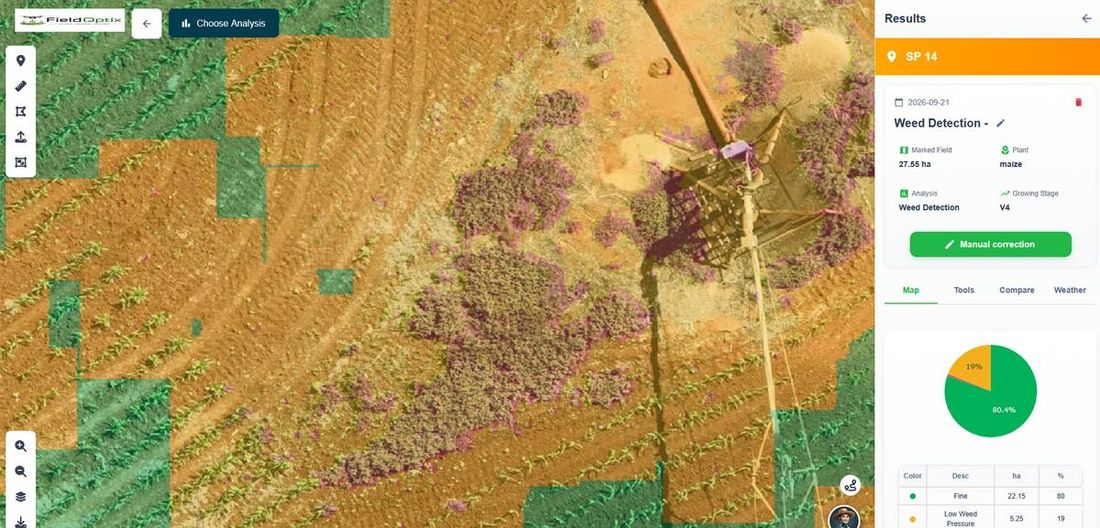
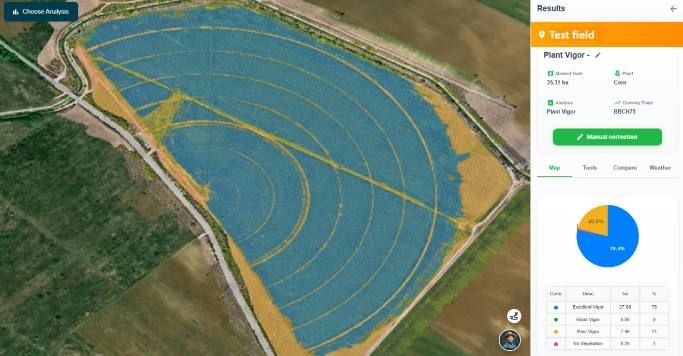
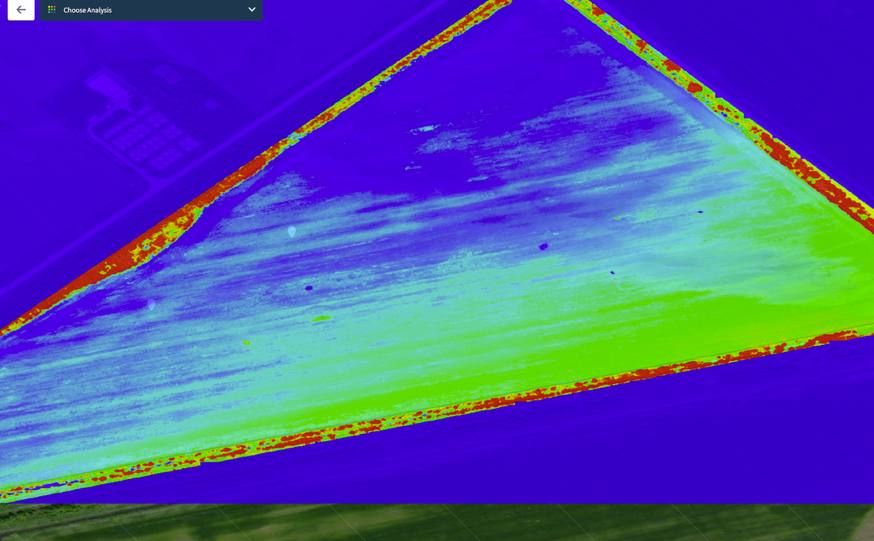
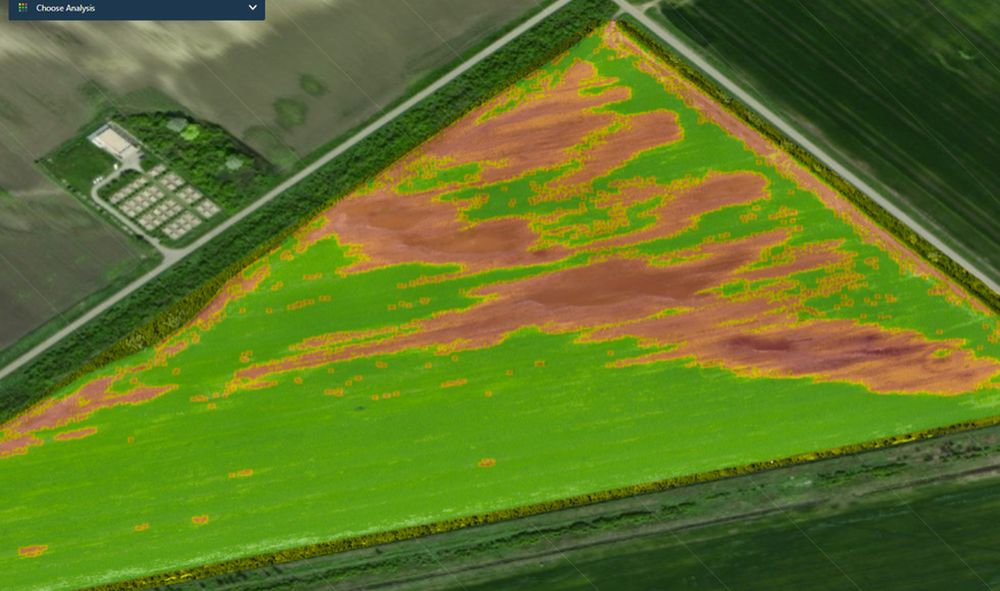
Every flight classifies the field into fine, low-pressure and high-pressure weed zones, and scores plant vigor from excellent to no vegetation. You see exactly where — not just a rough estimate.
Live weed detection map — fine (green), low pressure (gold), high pressure (red)
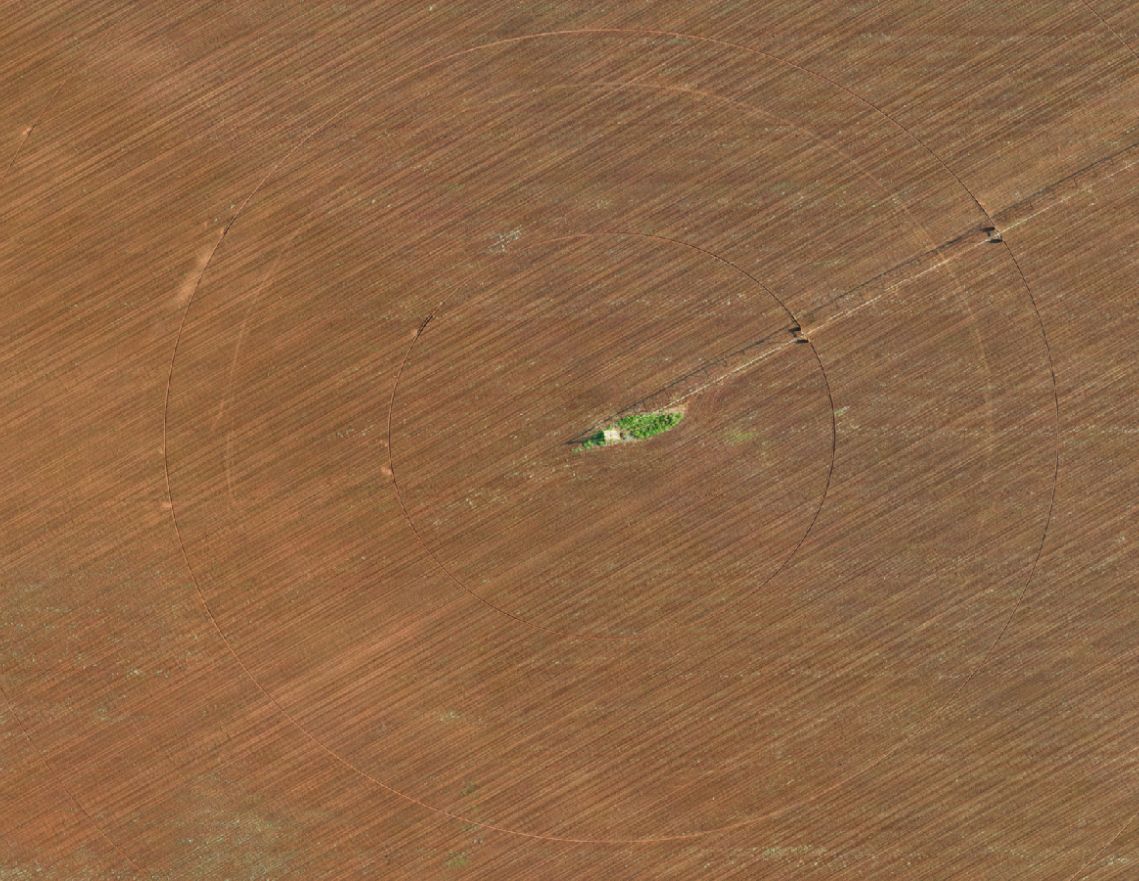
That pale ring in the photo isn’t a shadow. It’s disturbed, under-watered ground caused by a pivot nozzle that wasn’t spraying correctly. Invisible from the pivot point. Invisible from the road. Picked up on a routine flight, before it became a bare ring in the yield map at harvest.
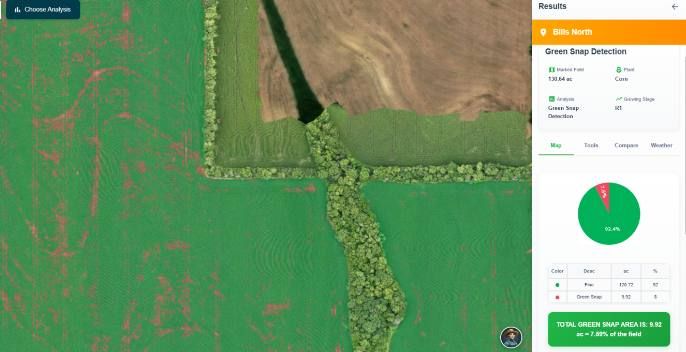
Weeds and vigor are two of the analyses. The same flight also flags green snap after a wind event, low-lying areas carrying moisture or elevation stress, and whether your variable-rate seeding plan actually landed the way it was prescribed.
Same pivot, five days apart. This is the difference between a snapshot and a season-long record — every intervention shows up in the next flight, so you know what’s working.
Weekly drone passes, every hectare, no sampling gaps.
Weed, vigor, stand count, wind and drainage stress — classified and quantified.
Variable-rate spray and fertilizer maps built straight from what the field is showing.
You correct. We fly again and confirm it worked.
Your field already tells you everything it needs. We make sure you see it every week — not just when it’s too late to fix.
Weekly through the growing season as standard, so nothing sits unseen for more than a few days.
Weed pressure, plant vigor, green snap after wind events, elevation and drainage stress, and seed-stand population — all classified and quantified from the same flight.
Resolution and coverage. We map at under a centimetre per pixel across 100% of the field — not a sampled estimate from a few hundred metres up.
A field map you can act on: weed and vigor zones, GPS-located problem areas like the nozzle ring above, and variable-rate prescriptions your equipment can run directly.
[Add your pricing or season-plan details here]
Your field already tells you everything it needs. We make sure you see it every week — not just when it’s too late to fix.
[Add your contact email and phone number here]