
Real Results
Real flights. Real catches. Real numbers.
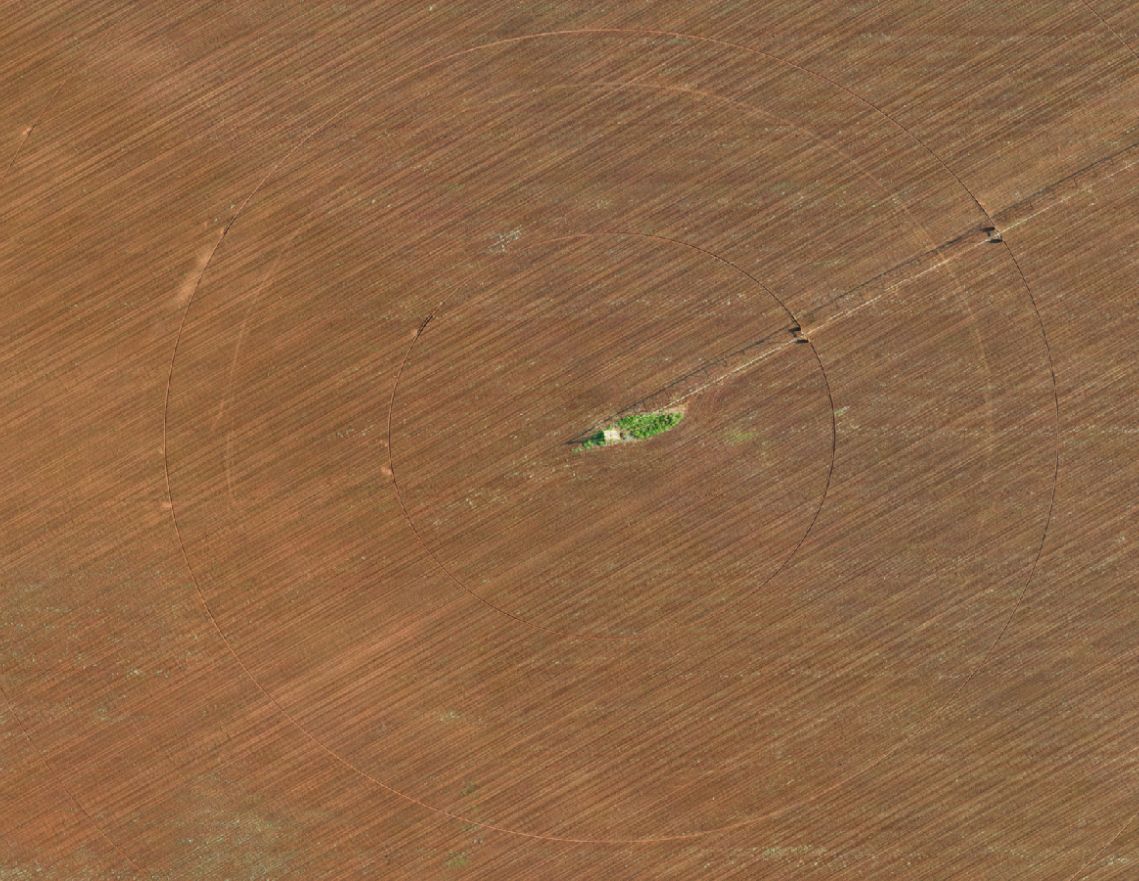
Four examples pulled straight from FieldOptix flights — what we found, what it meant on the ground, and what happened next.
01 — Weed pressure & plant health
Weed pressure and plant health, mapped to the square metre.
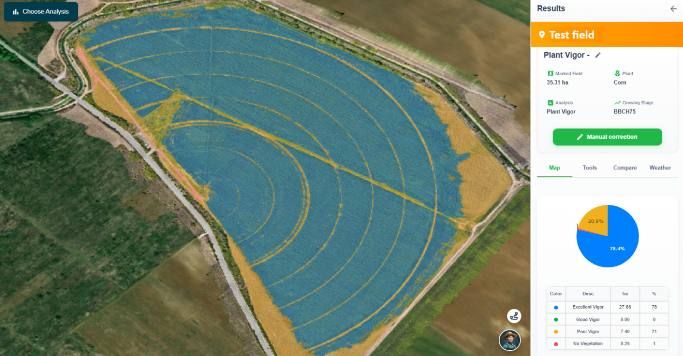
Every flight classifies the field into fine, low-pressure and high-pressure weed zones, and scores plant vigor from excellent to no vegetation. You see exactly where — not just a rough estimate.
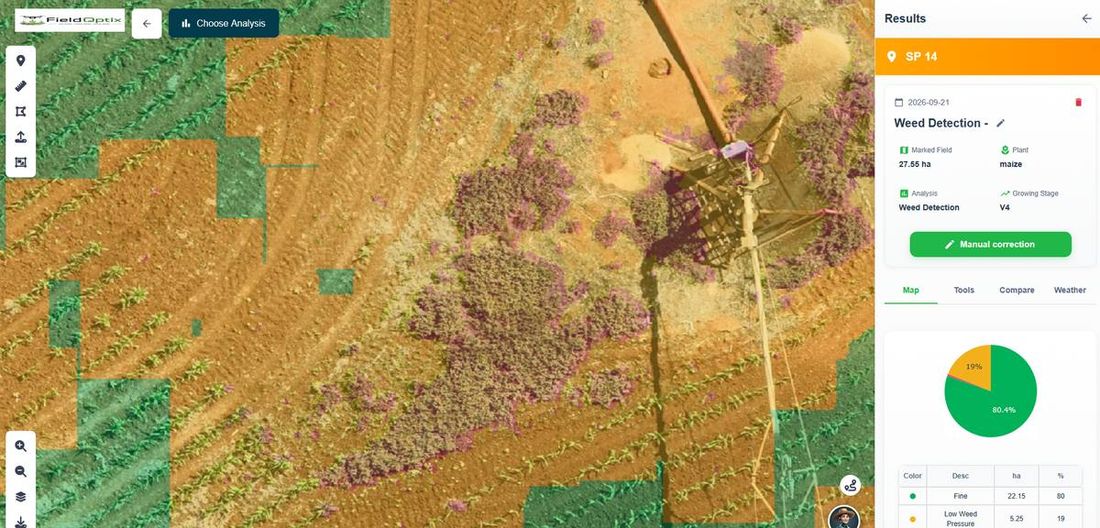
Live weed detection map — fine (green), low pressure (gold), high pressure (red)
02 — A real catch
This ring cost nothing to find — and a lot to ignore.
That pale ring in the photo isn’t a shadow. It’s disturbed, under-watered ground caused by a pivot nozzle that wasn’t spraying correctly. Invisible from the pivot point. Invisible from the road. Picked up on a routine flight, before it became a bare ring in the yield map at harvest.
- Caught early — flagged the same week it appeared
- Located precisely — exact GPS position handed to the irrigation team
- Fixed in one visit — instead of found after the damage was done
03 — The full picture
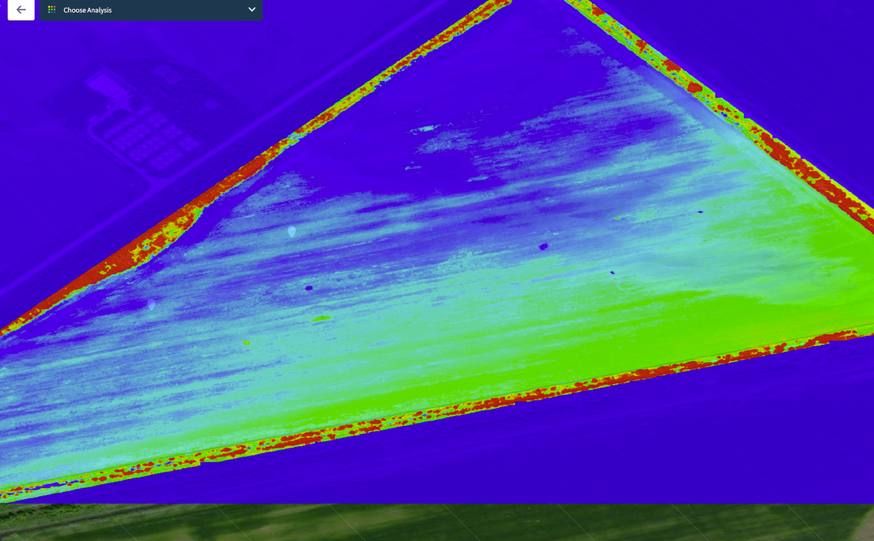
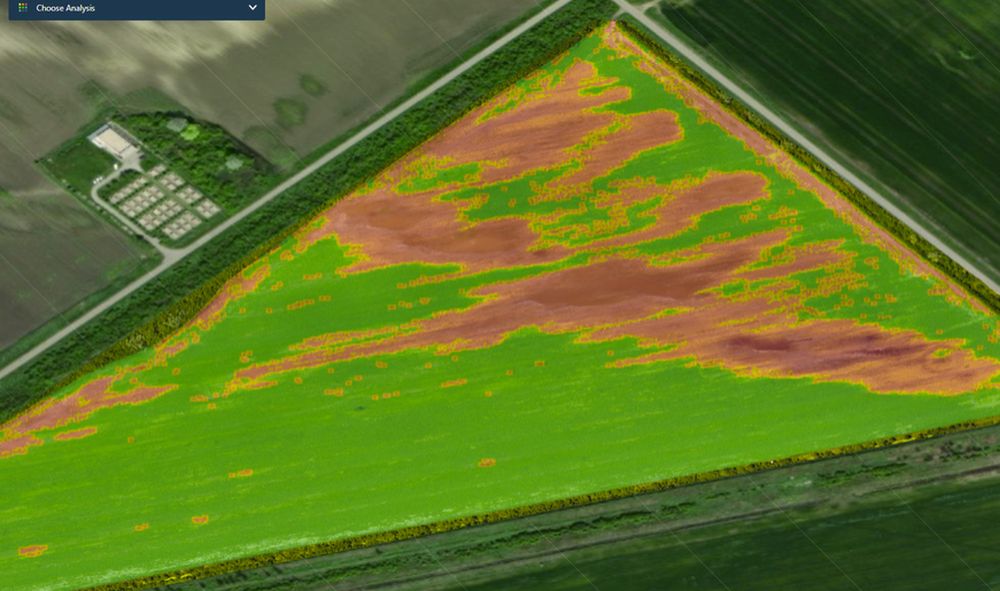
Wind damage, drainage stress, seed population — all in one flight.
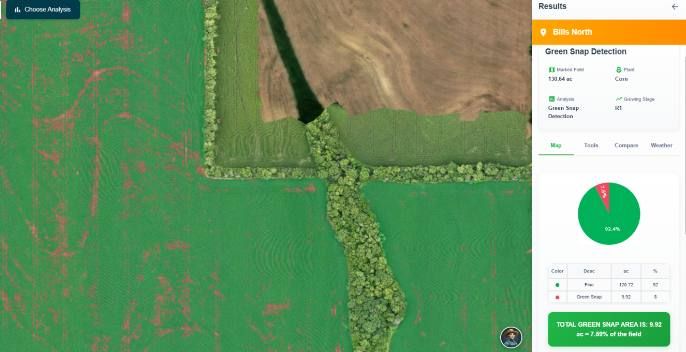
Weeds and vigor are two of the analyses. The same flight also flags green snap after a wind event, low-lying areas carrying moisture or elevation stress, and whether your variable-rate seeding plan actually landed the way it was prescribed.
04 — Seeding, verified
Did your variable-rate seeding plan actually land? Now you can check.
After planting, a flight counts every emerged plant and checks it zone by zone against the population your VRS prescription actually called for — not one average for the whole field, but a real per-zone comparison that catches planter skips, rate errors or emergence problems before they cost yield.
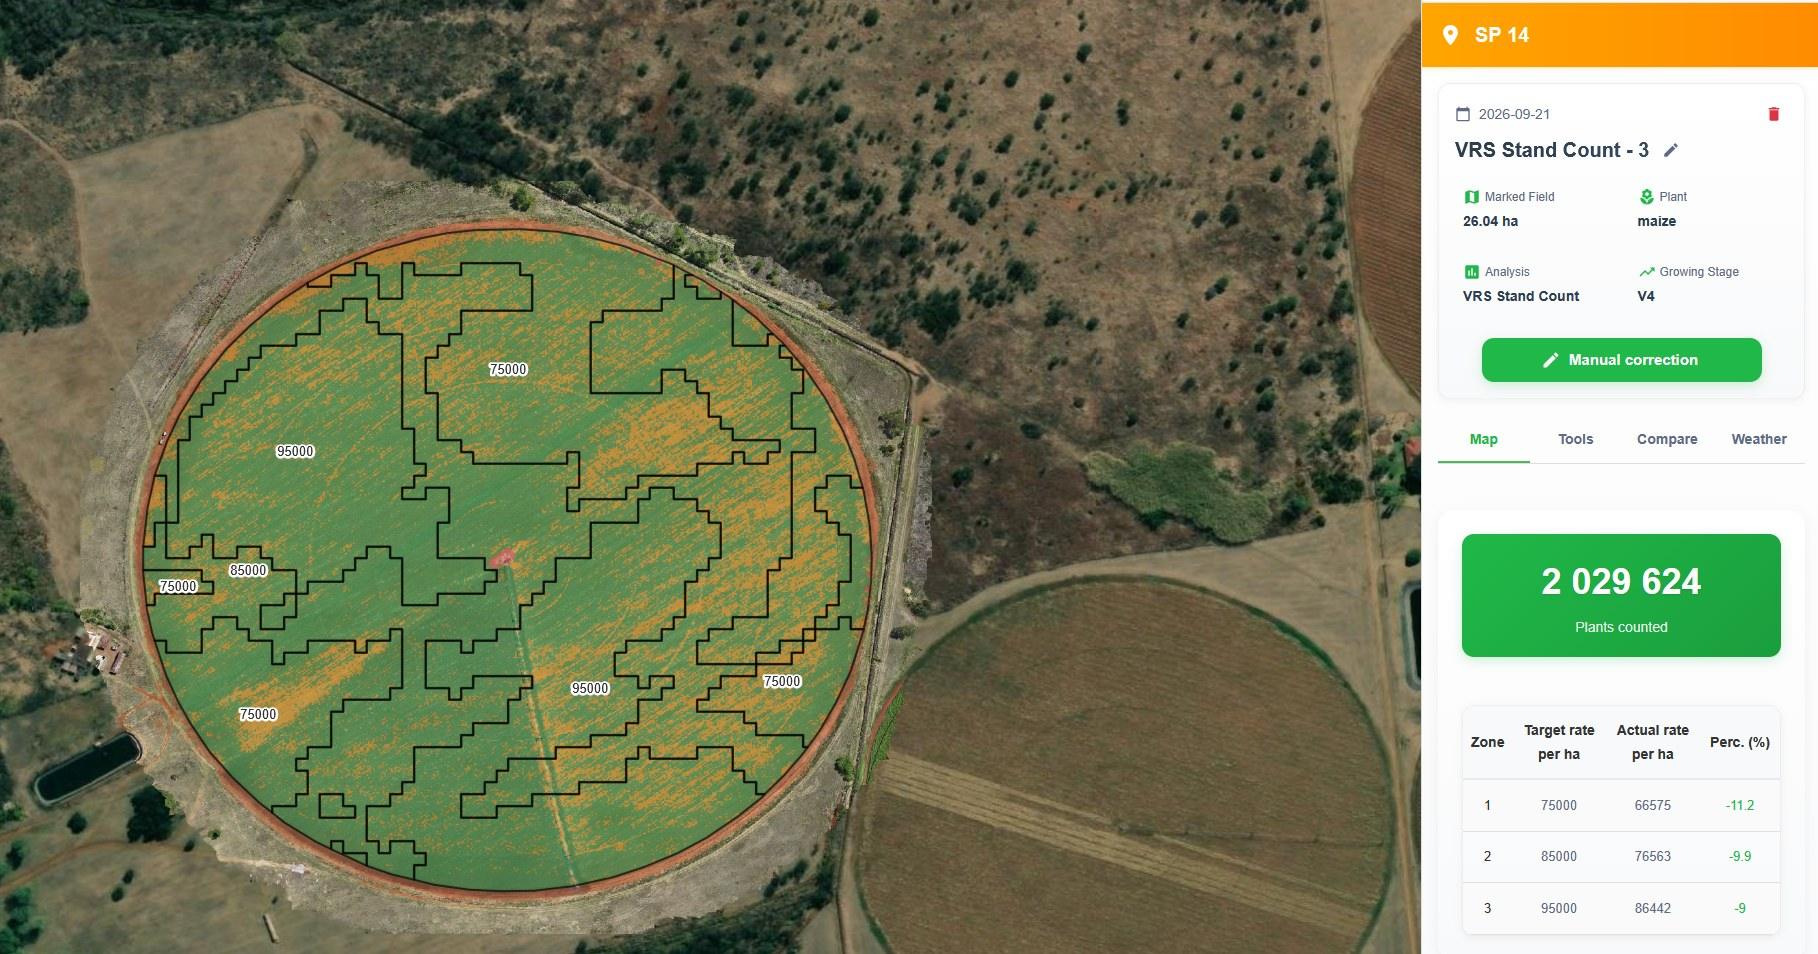
Live VRS stand-count verification — actual plant population per zone, checked against the seeding prescription
05 — Rodent damage, quantified
Rodent damage, counted plant by plant.
Rodent holes and bare patches showed up from the air on a young maize field at V2. A stand count over the whole 9.95 ha field counted 315,986 plants against 445,051 planned — 29% under norm, close to 129,065 plants missing — and mapped exactly where the gaps are.
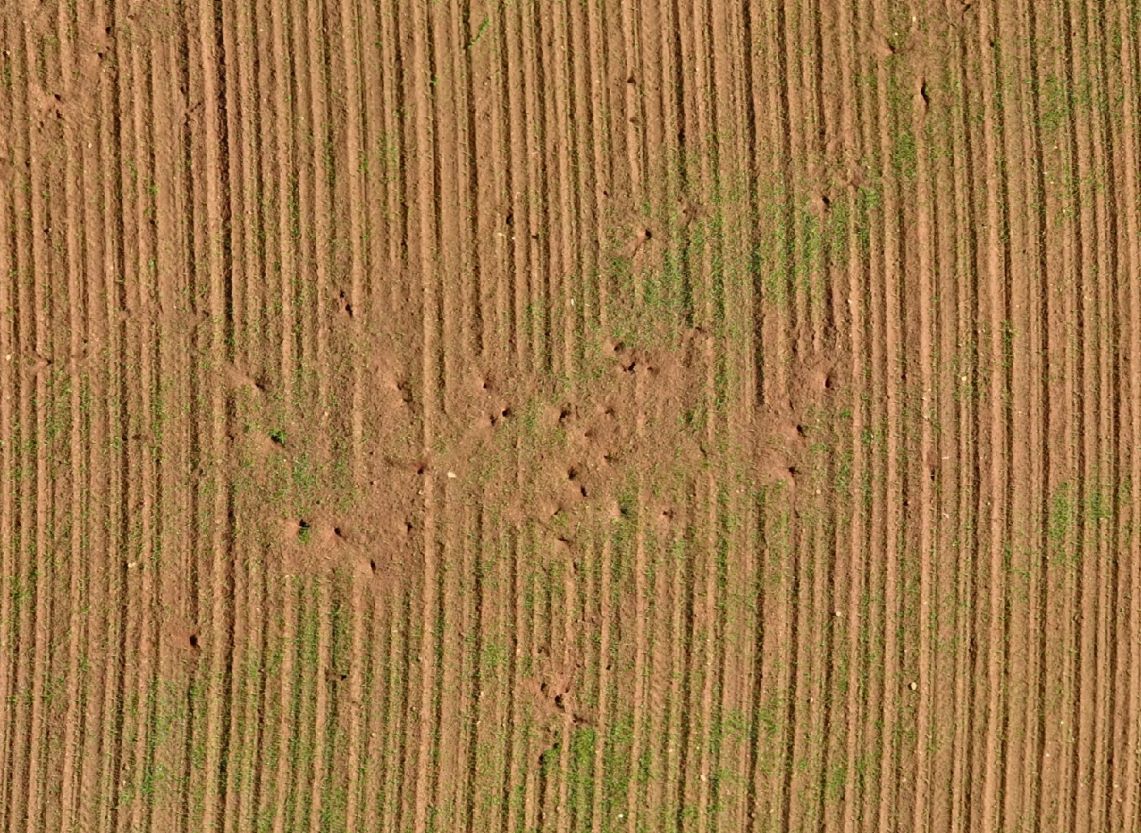
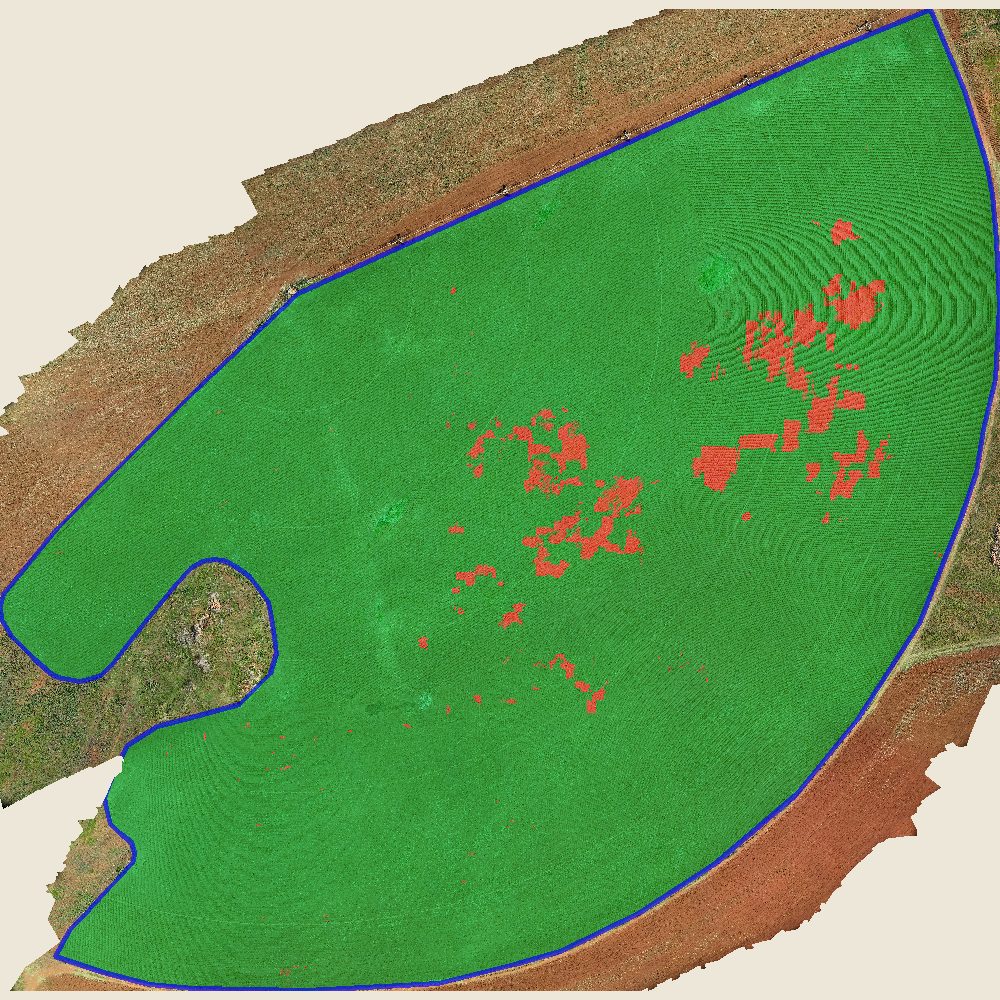
Rodent damage from the air, and the stand count that measured it — red marks where plants are missing.
Want results like this from your own fields?
Same drone, same analysis, same level of detail — on your hectares.