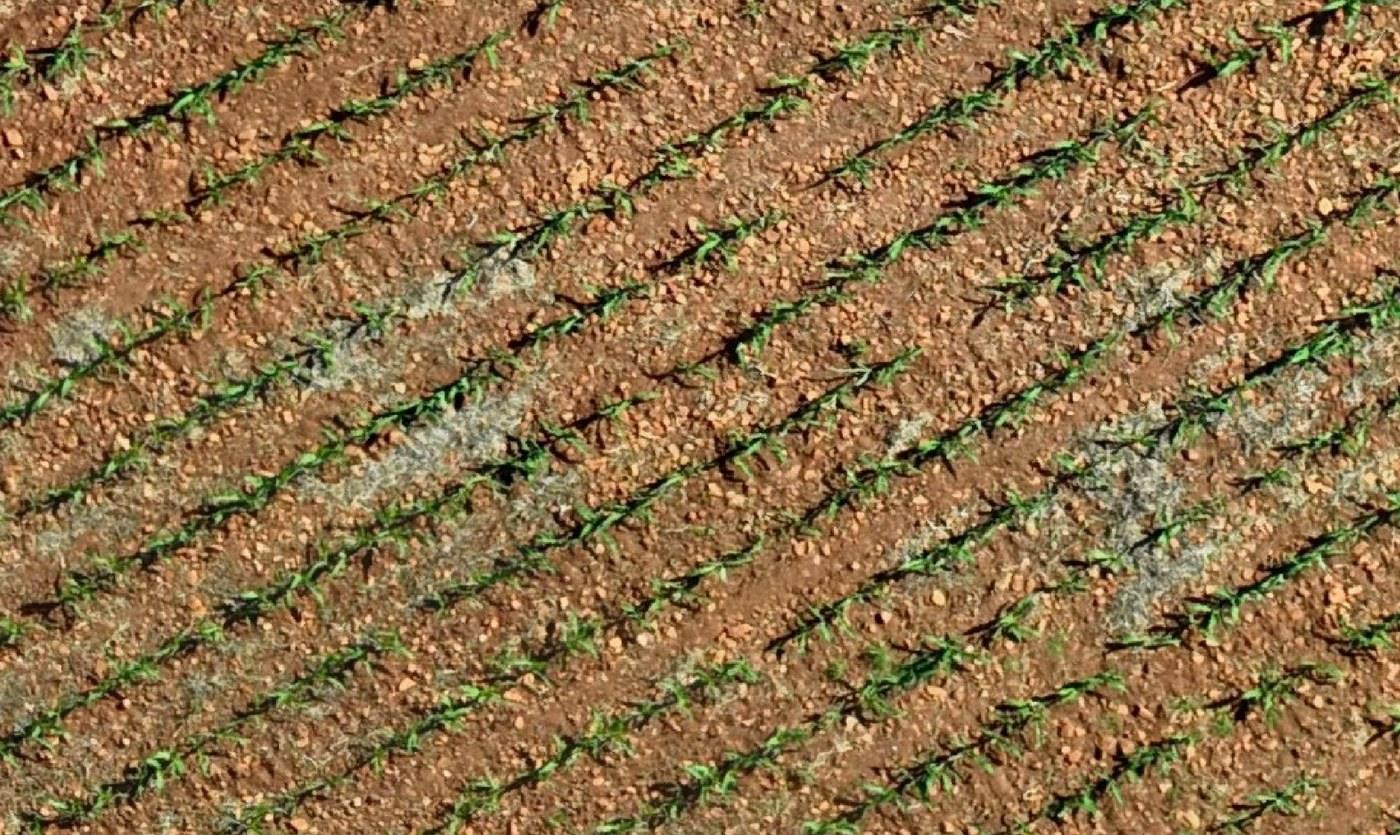
Weed Pressure Mapping
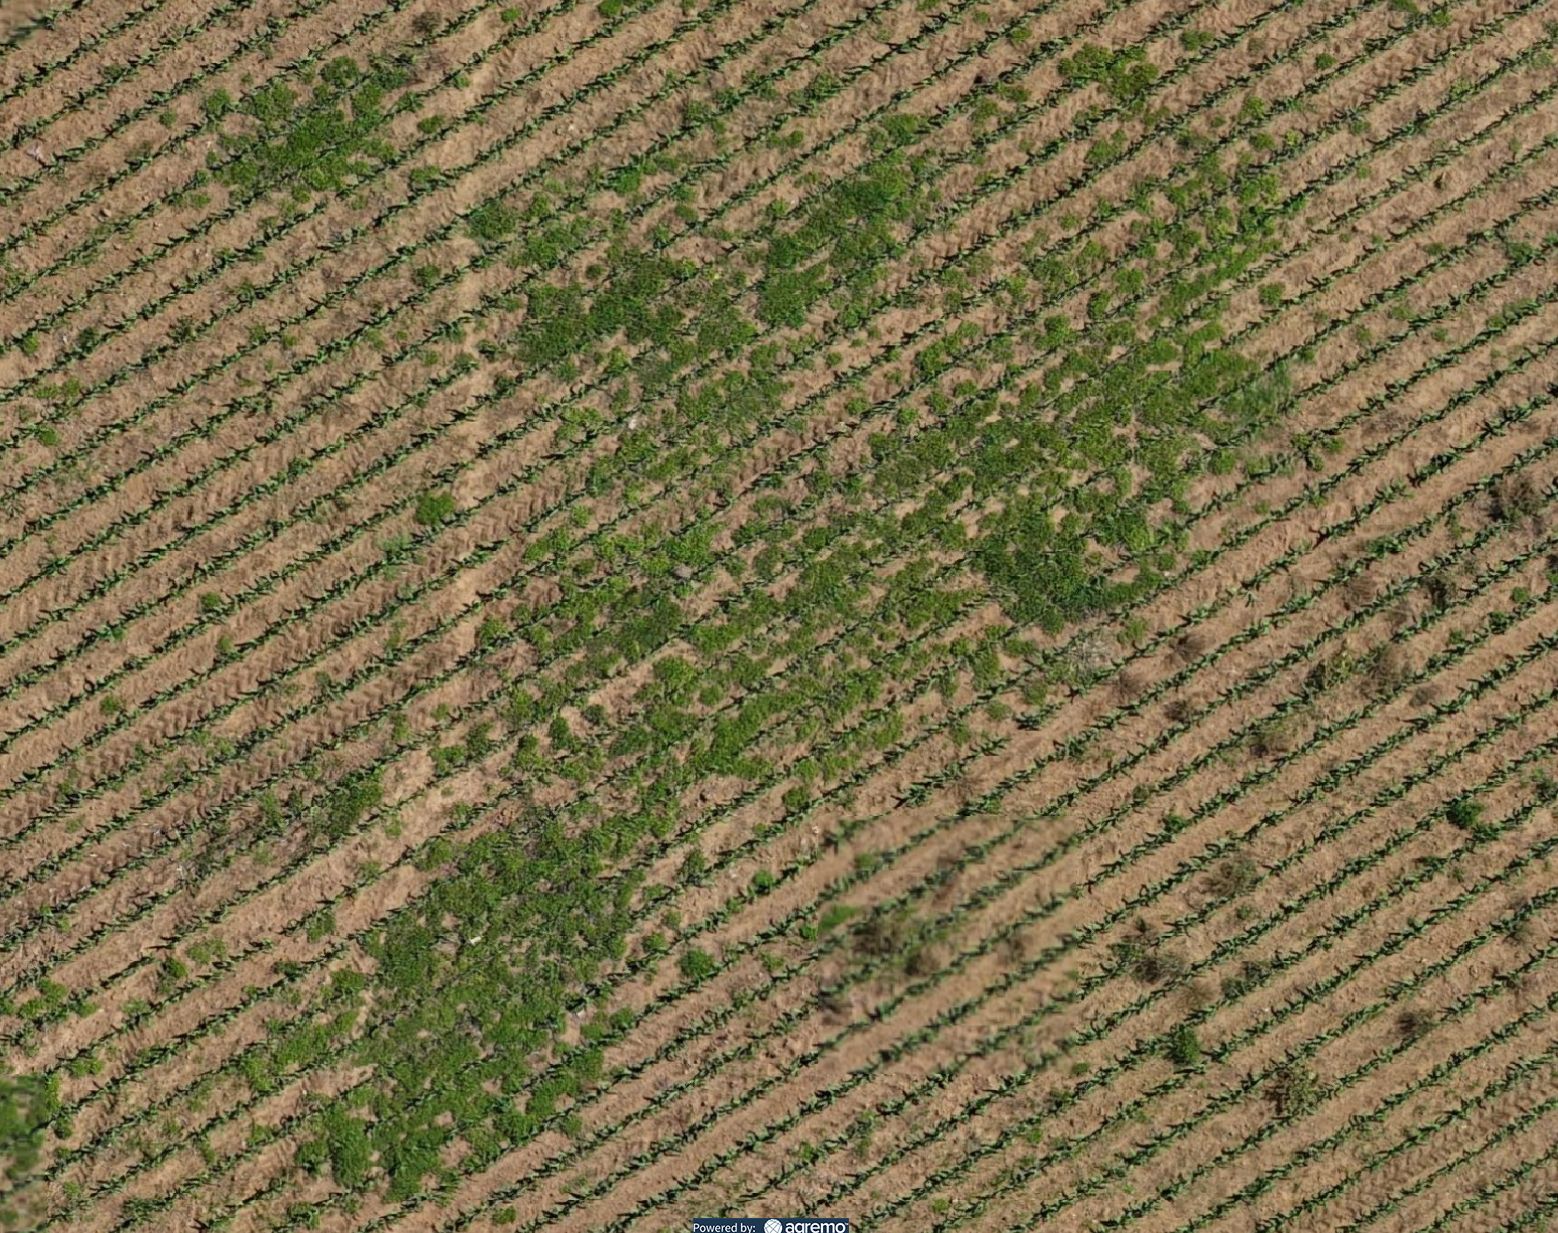
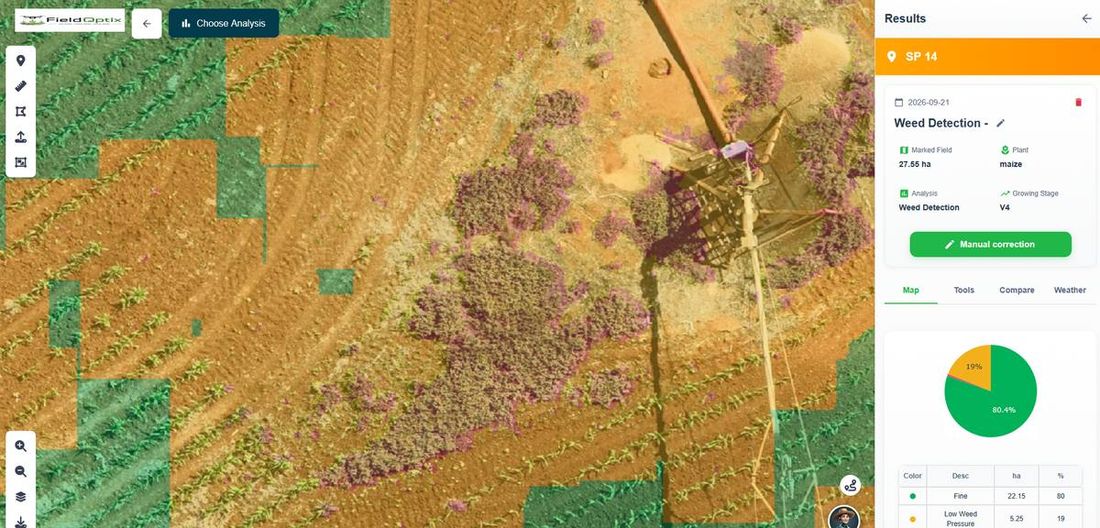
Every hectare classified into fine, low- and high-pressure zones, so you spray exactly where it counts.

What We Do
Everything we map, measure and prescribe, and the answers to what growers ask most.
What We Do
Eight ways we turn a single drone flight into decisions you can act on this week — all powered by world-class software and AI.
Every hectare classified into fine, low- and high-pressure zones, so you spray exactly where it counts.
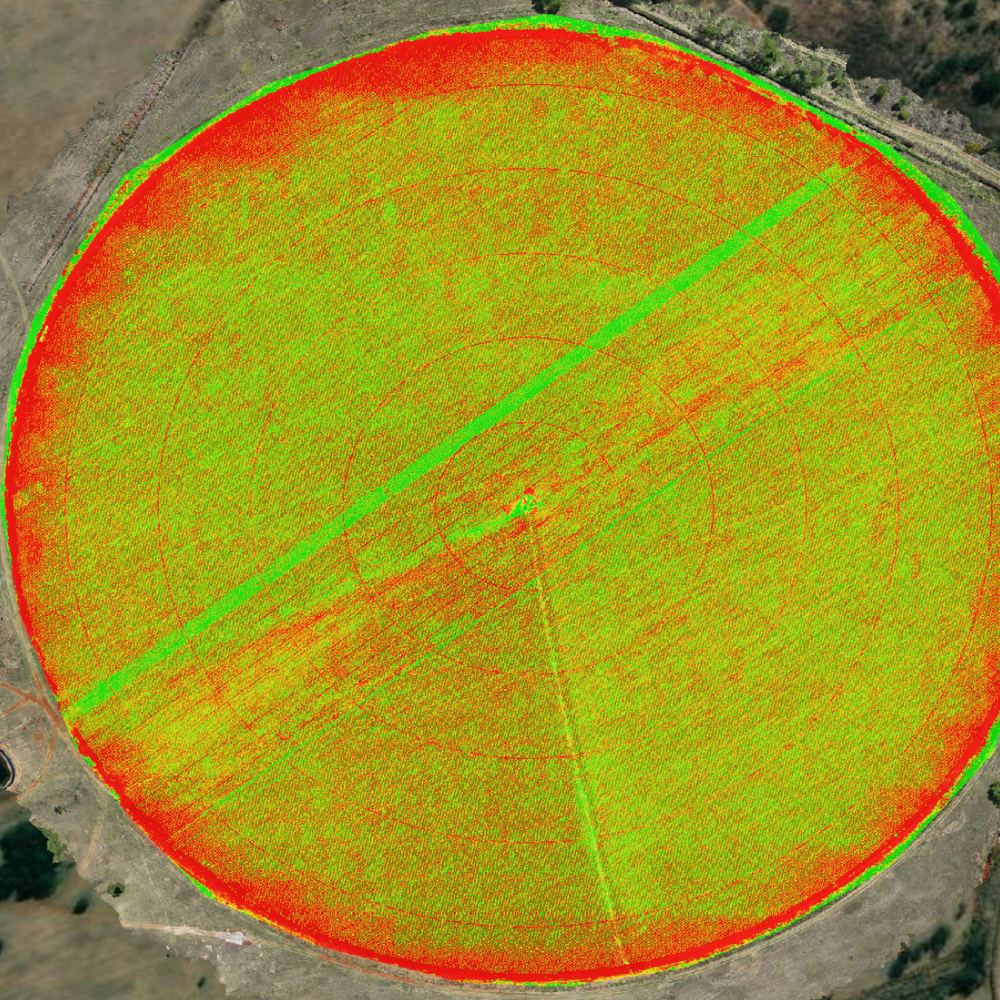
Visual NDVI scores plant health from excellent to bare ground, catching stress before it’s visible on foot.
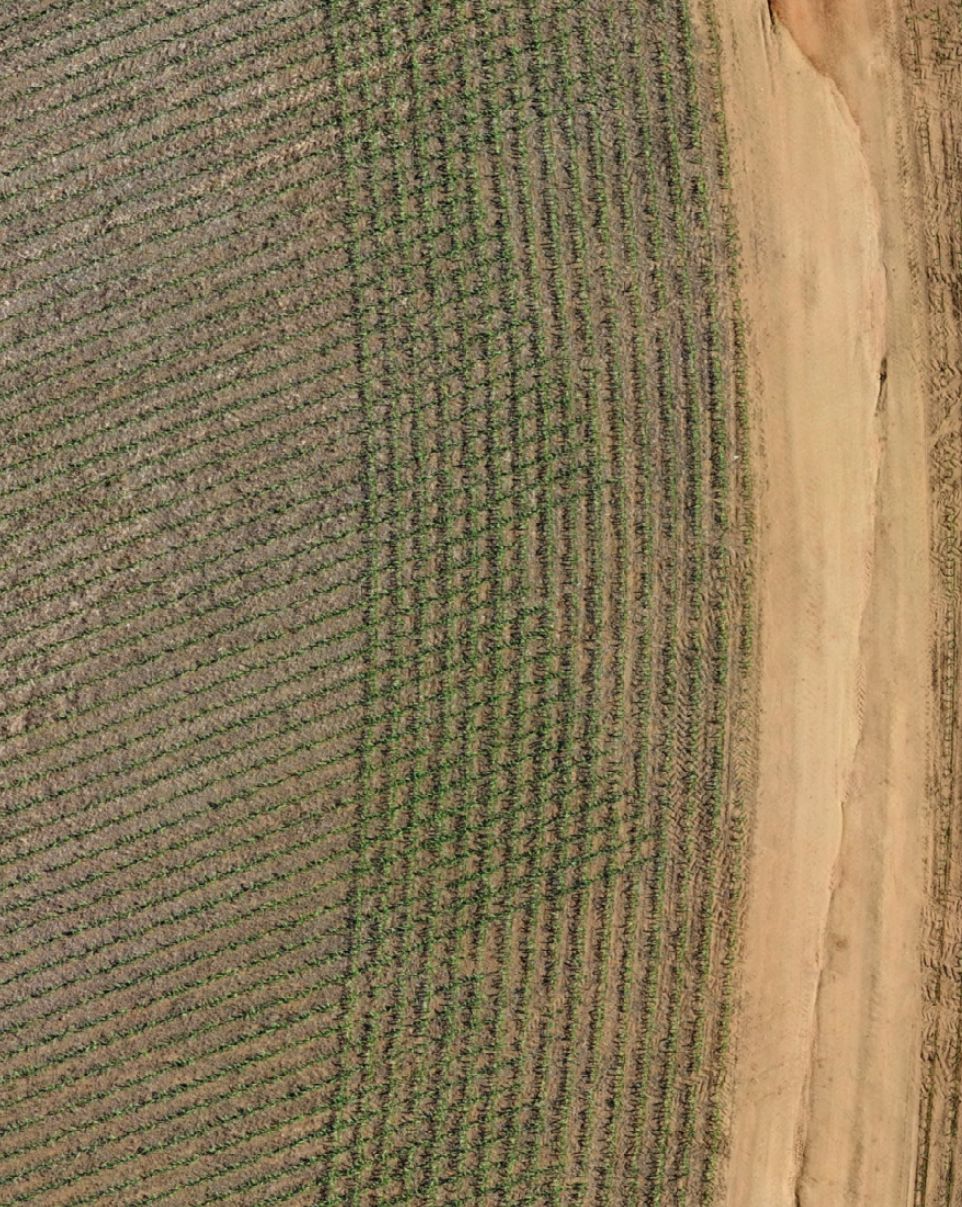
Every plant counted from the air and benchmarked against your planting norm, hectare by hectare.
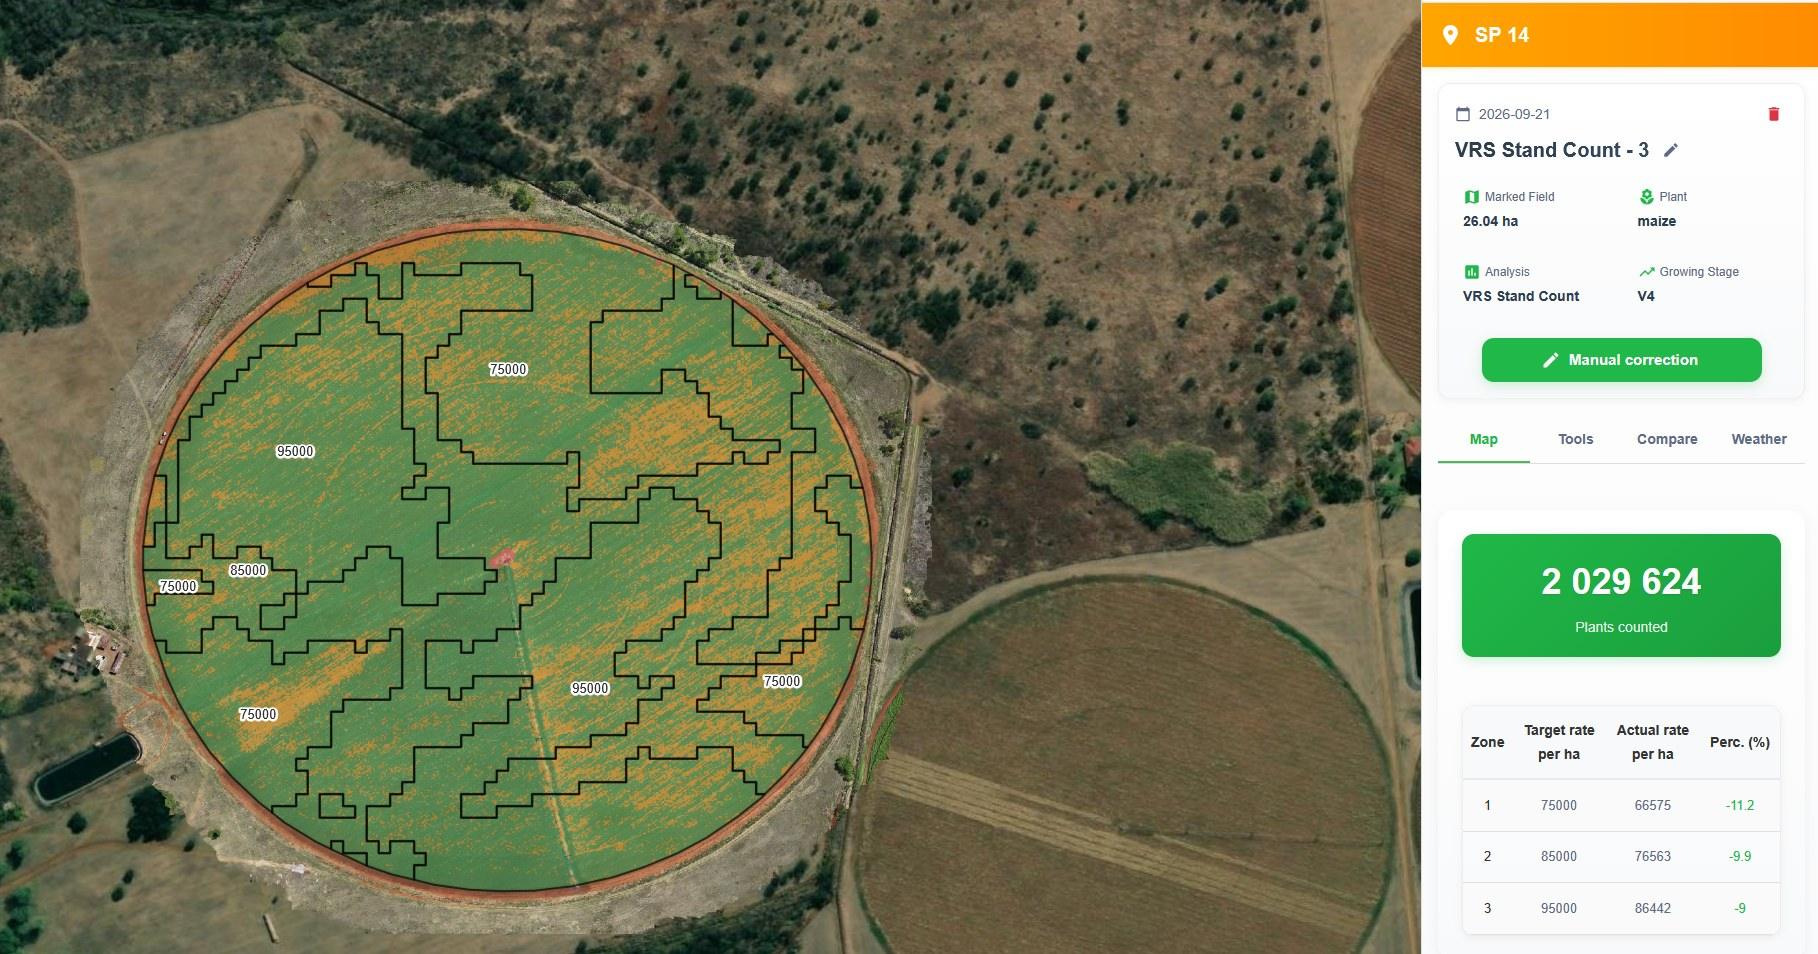
We fly back after planting to confirm your VRS prescription landed at the rate it was written for.
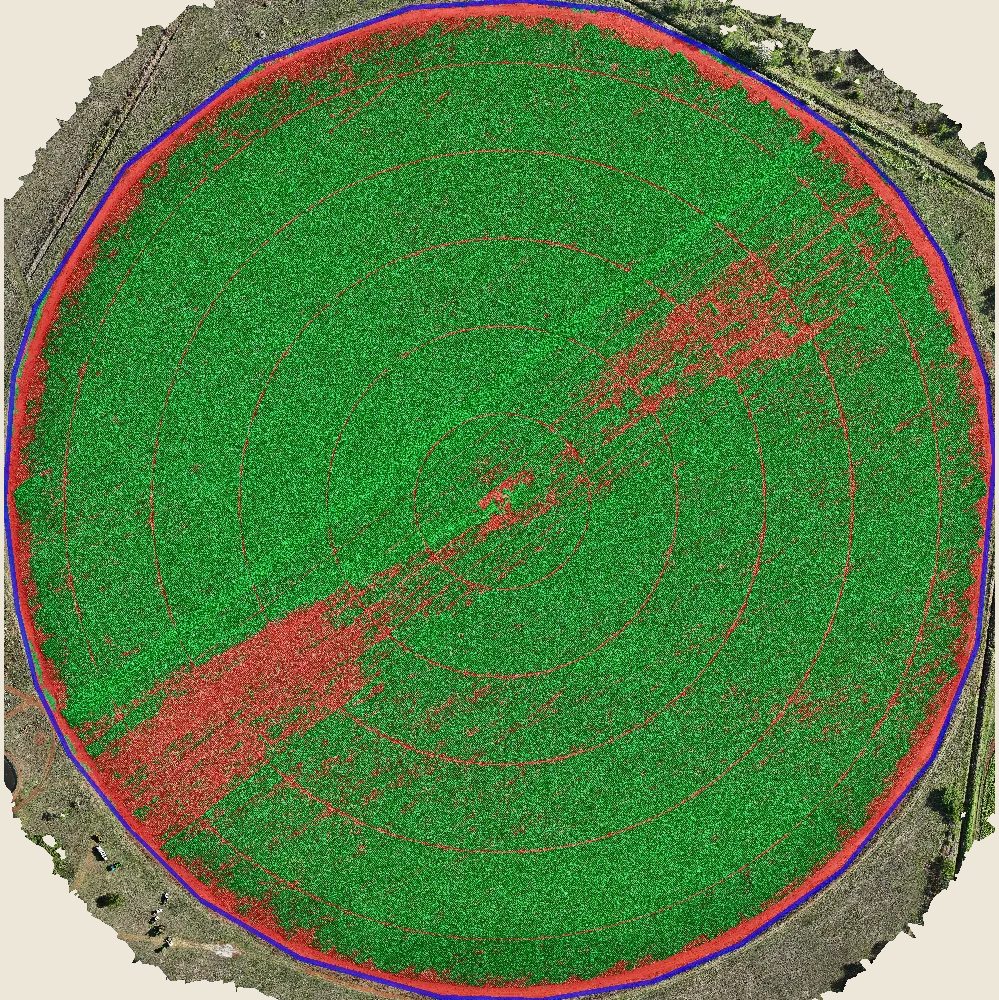
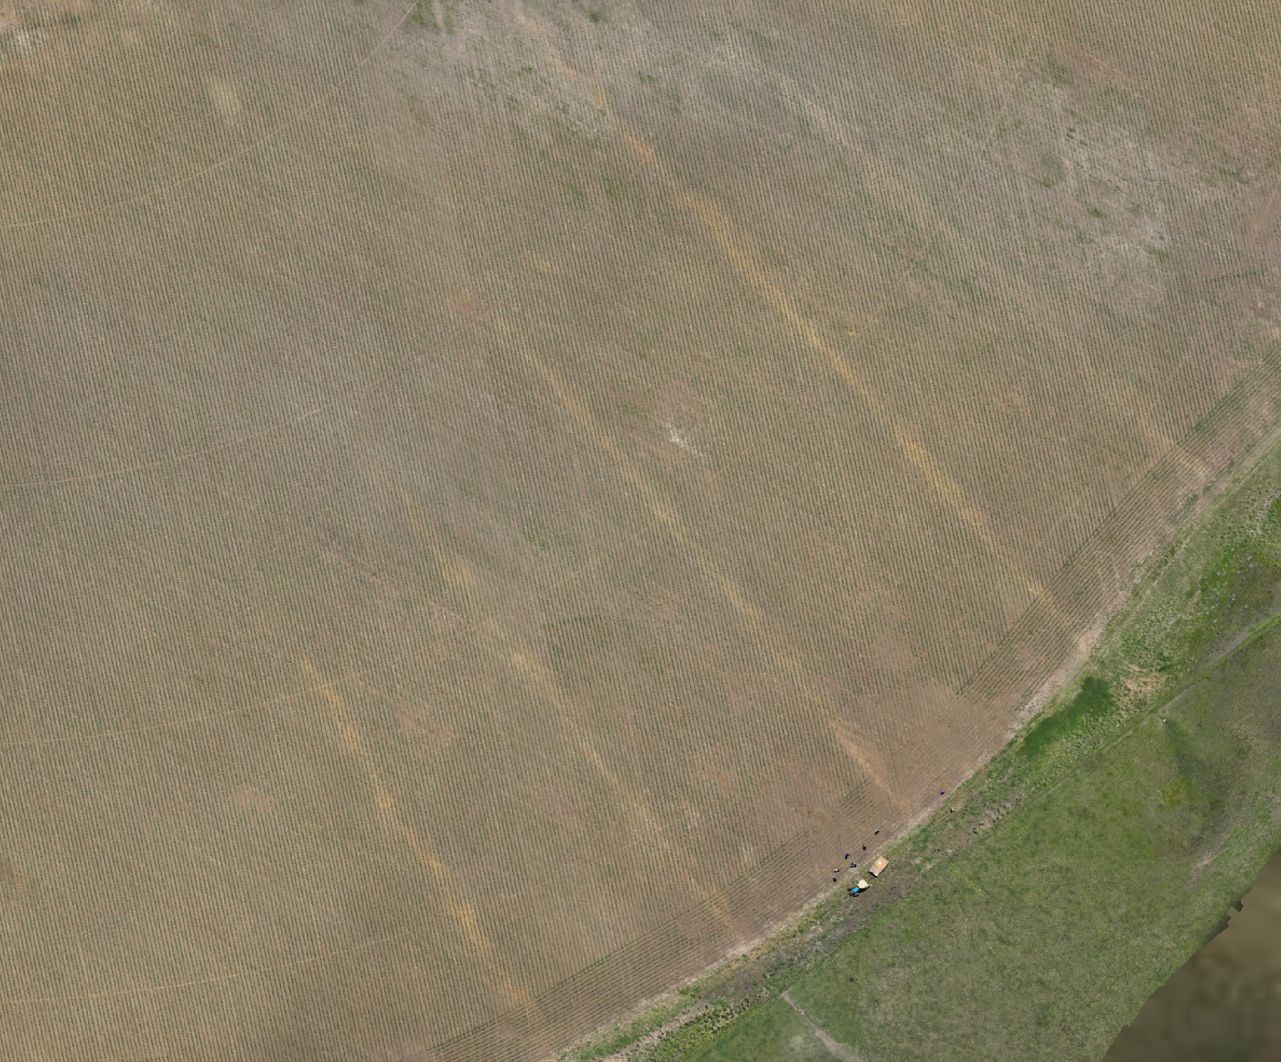
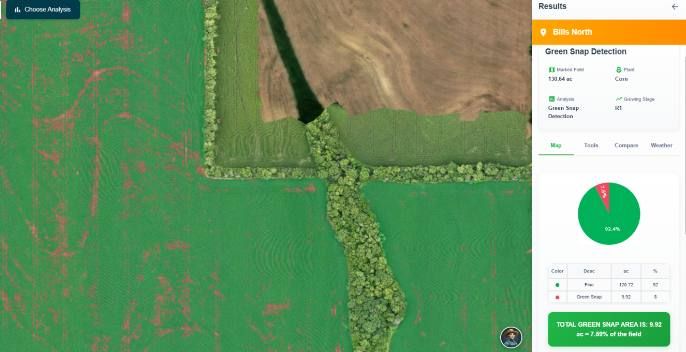
Green snap and lodging mapped and quantified within days of a wind event — not weeks.
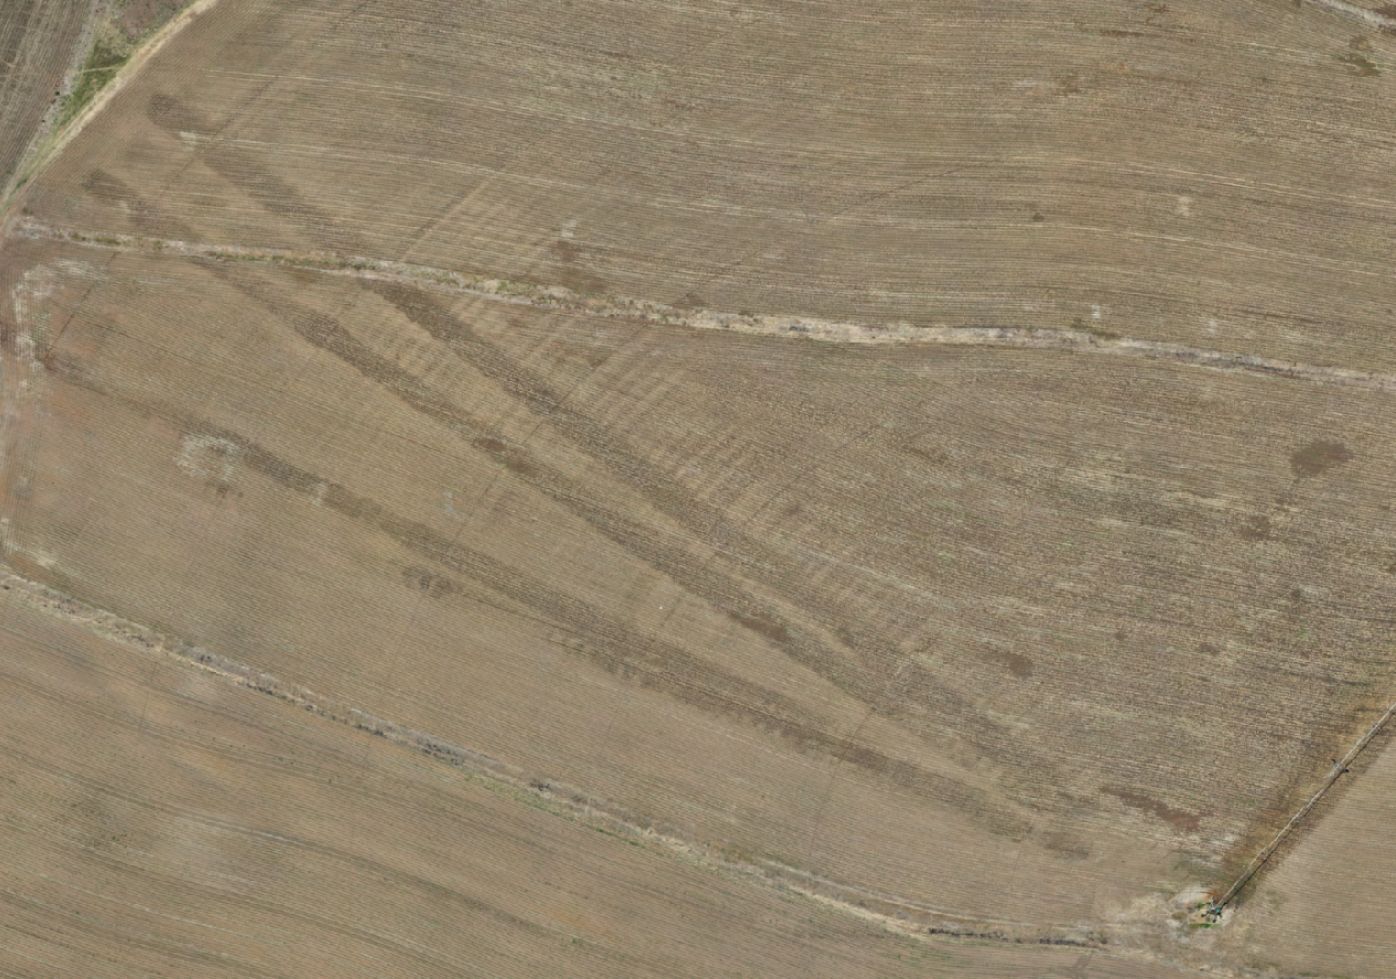
Low-lying and waterlogged zones cross-checked against elevation, before they cost you at harvest.
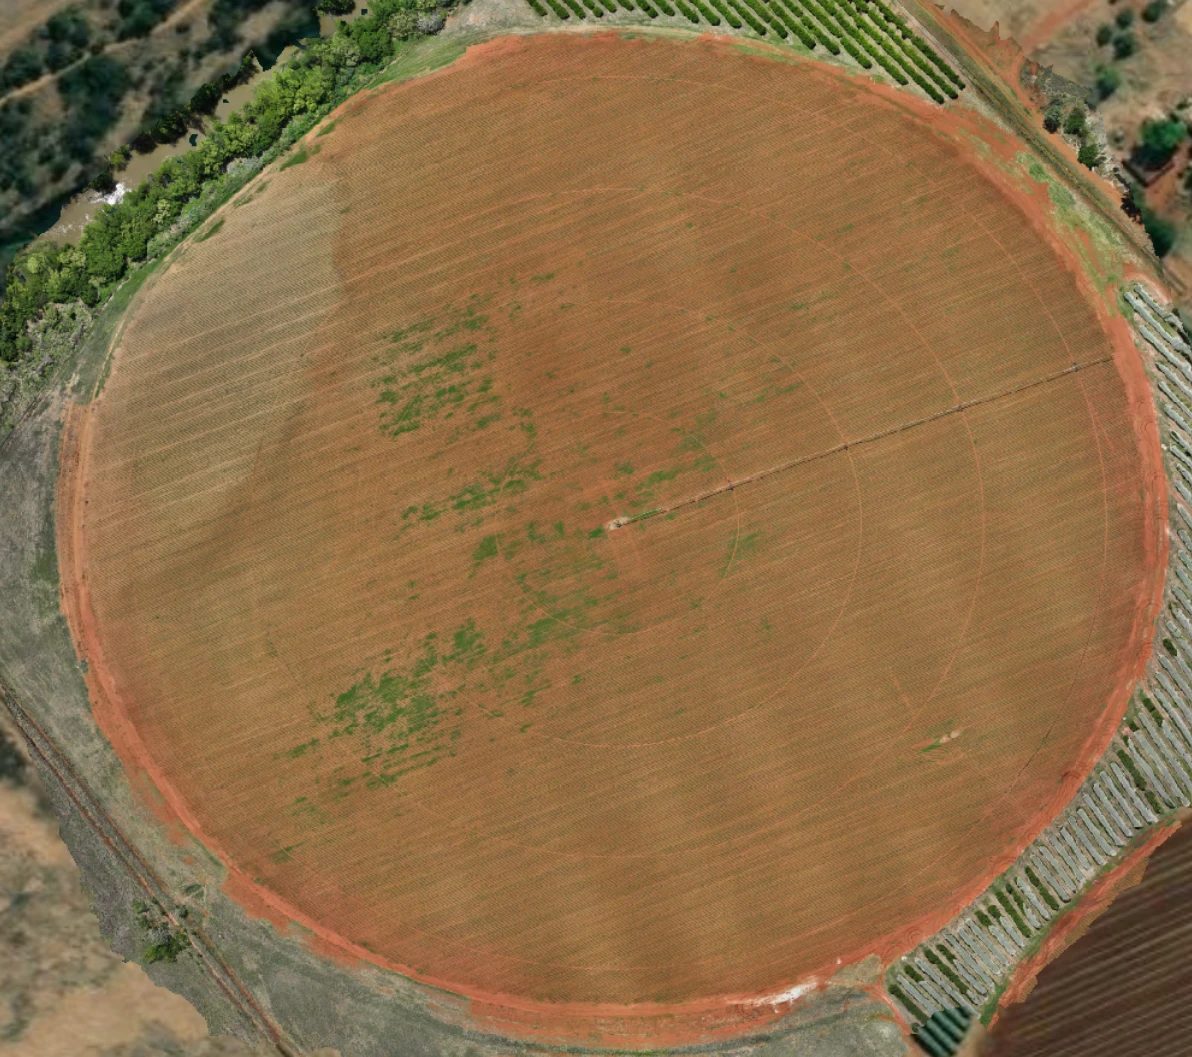
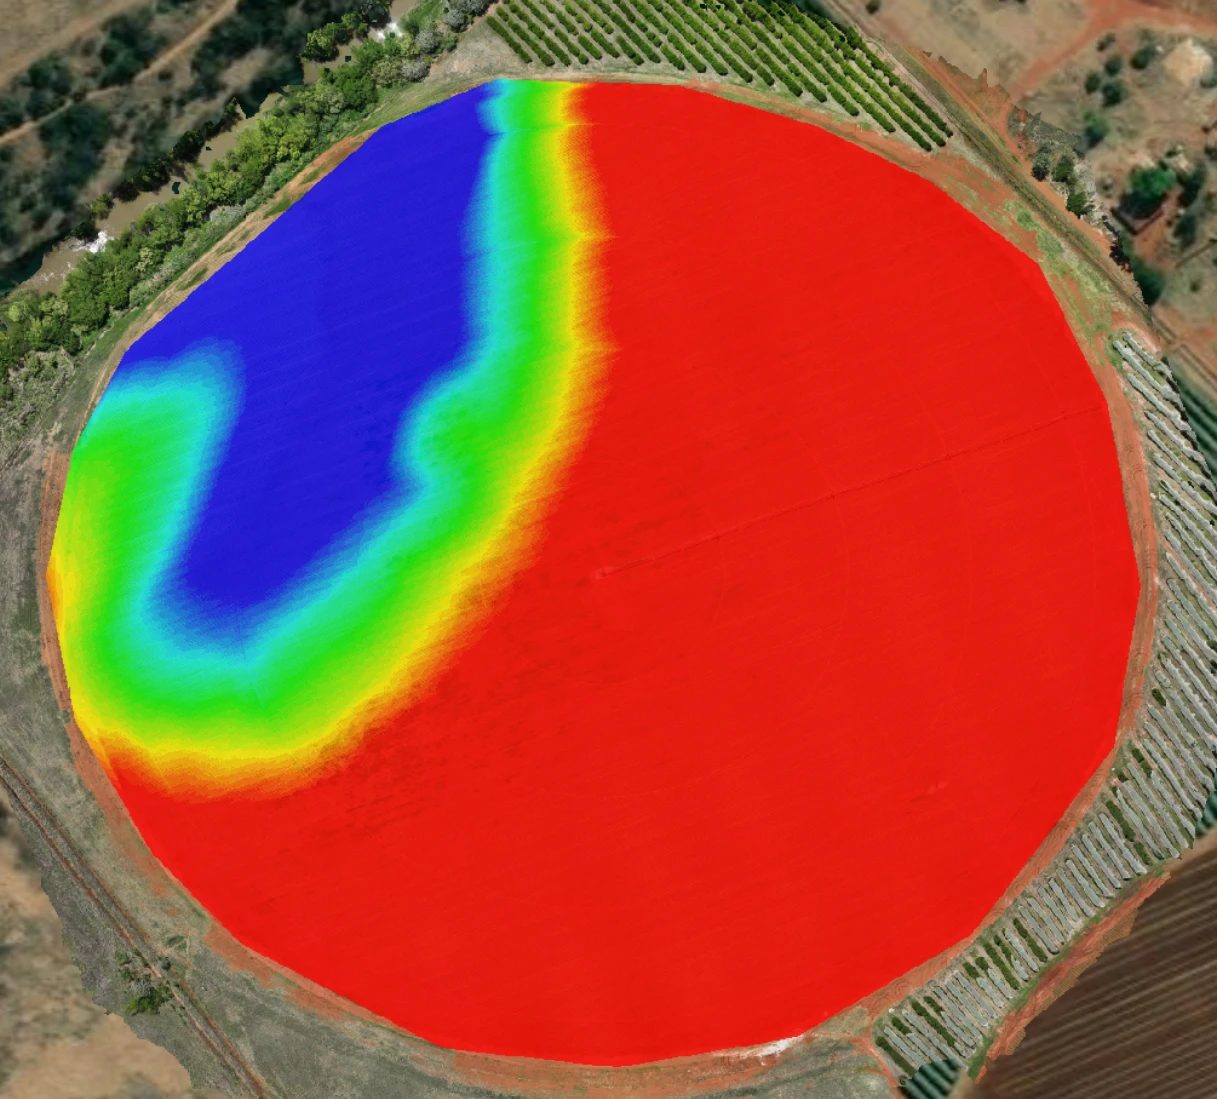
Track V-stage and canopy development across the whole field, corner to corner, flight to flight.
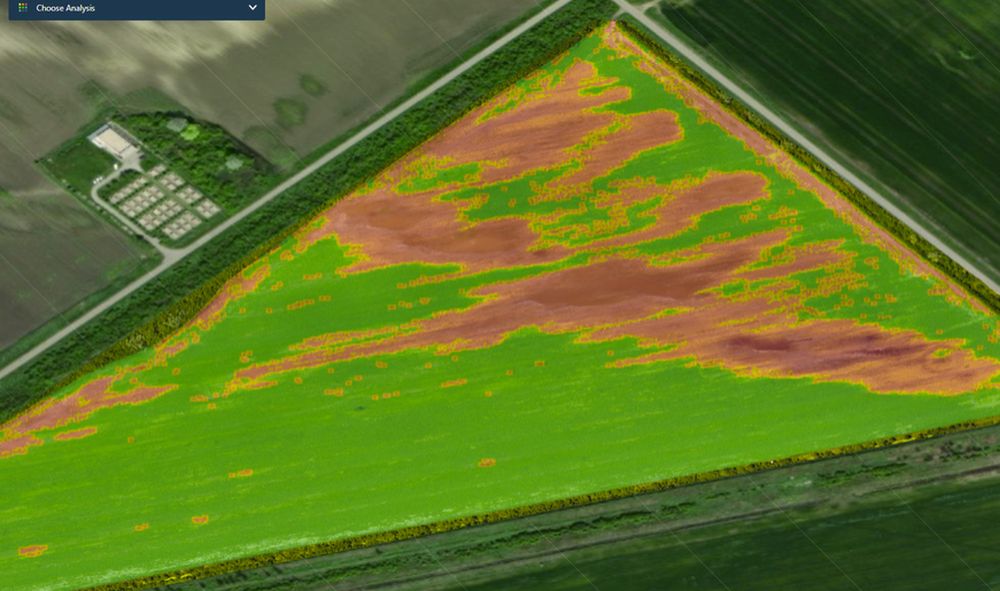
World-class software and AI turn every flight into a variable-rate map your equipment can run directly.
Prescription-Ready
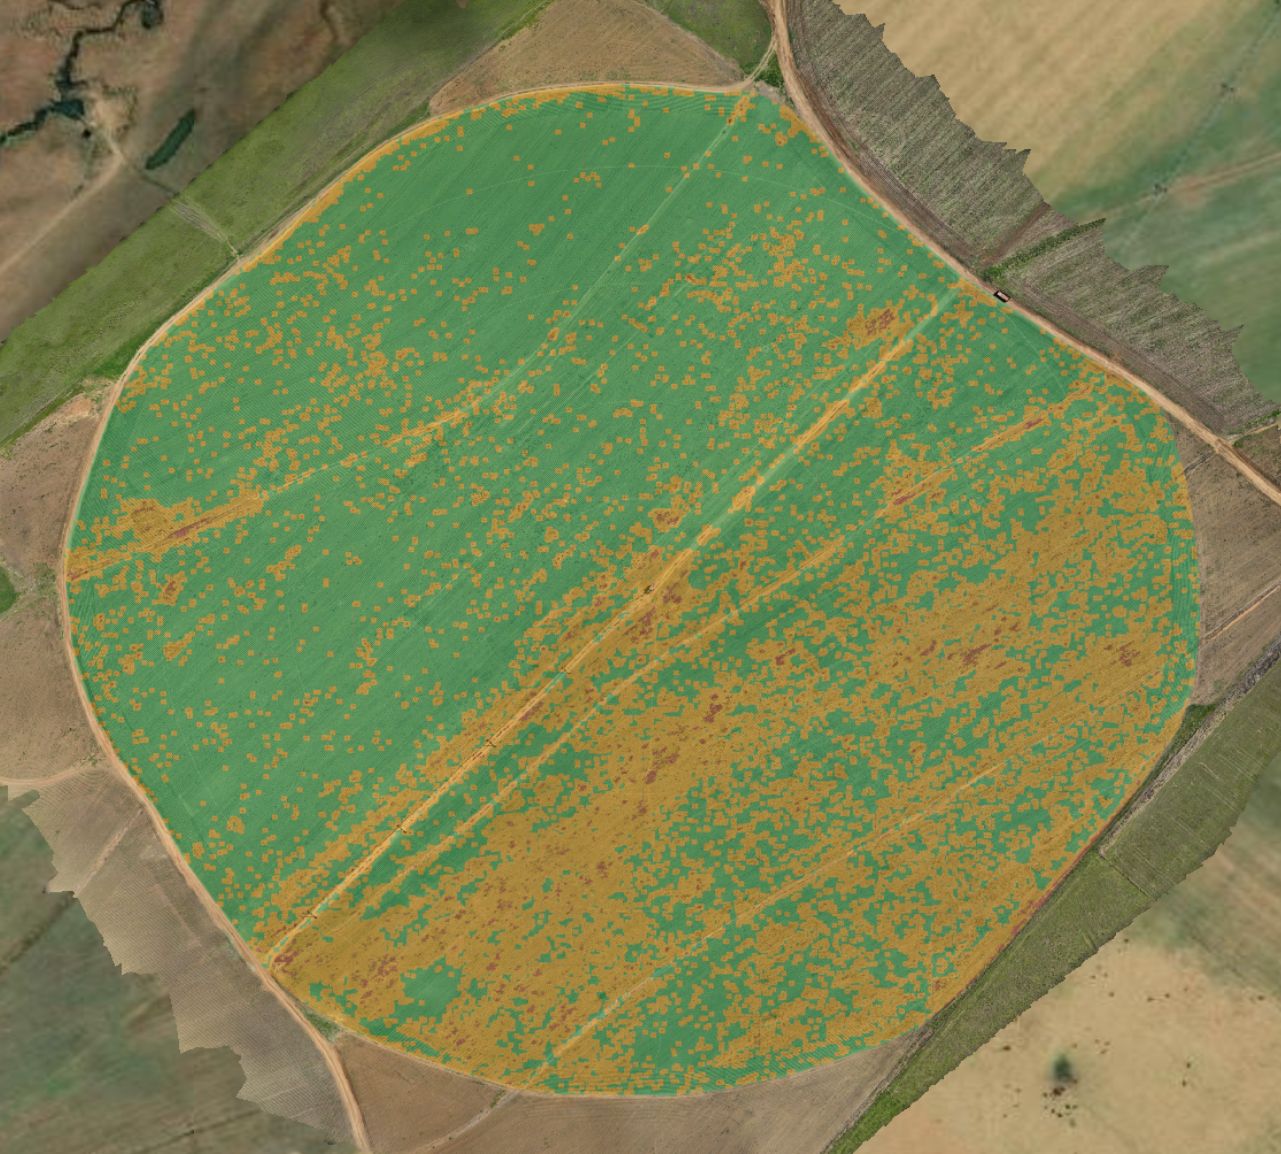
Once a flight is analysed, we write variable-rate prescriptions straight from the results — targeting only the zones that need it, instead of treating the whole field the same way.
Illustrative variable-rate prescription — the same approach applies to spray and fertilizer maps.
Your field already tells you everything it needs. We make sure you see it at every stage that matters — not just when it’s too late to fix.
Crops We Fly
From dryland grain on the Highveld to subtropical orchards in the Lowveld — if it’s planted in rows, blocks or centre pivots, we can fly it, map it and prescribe for it.
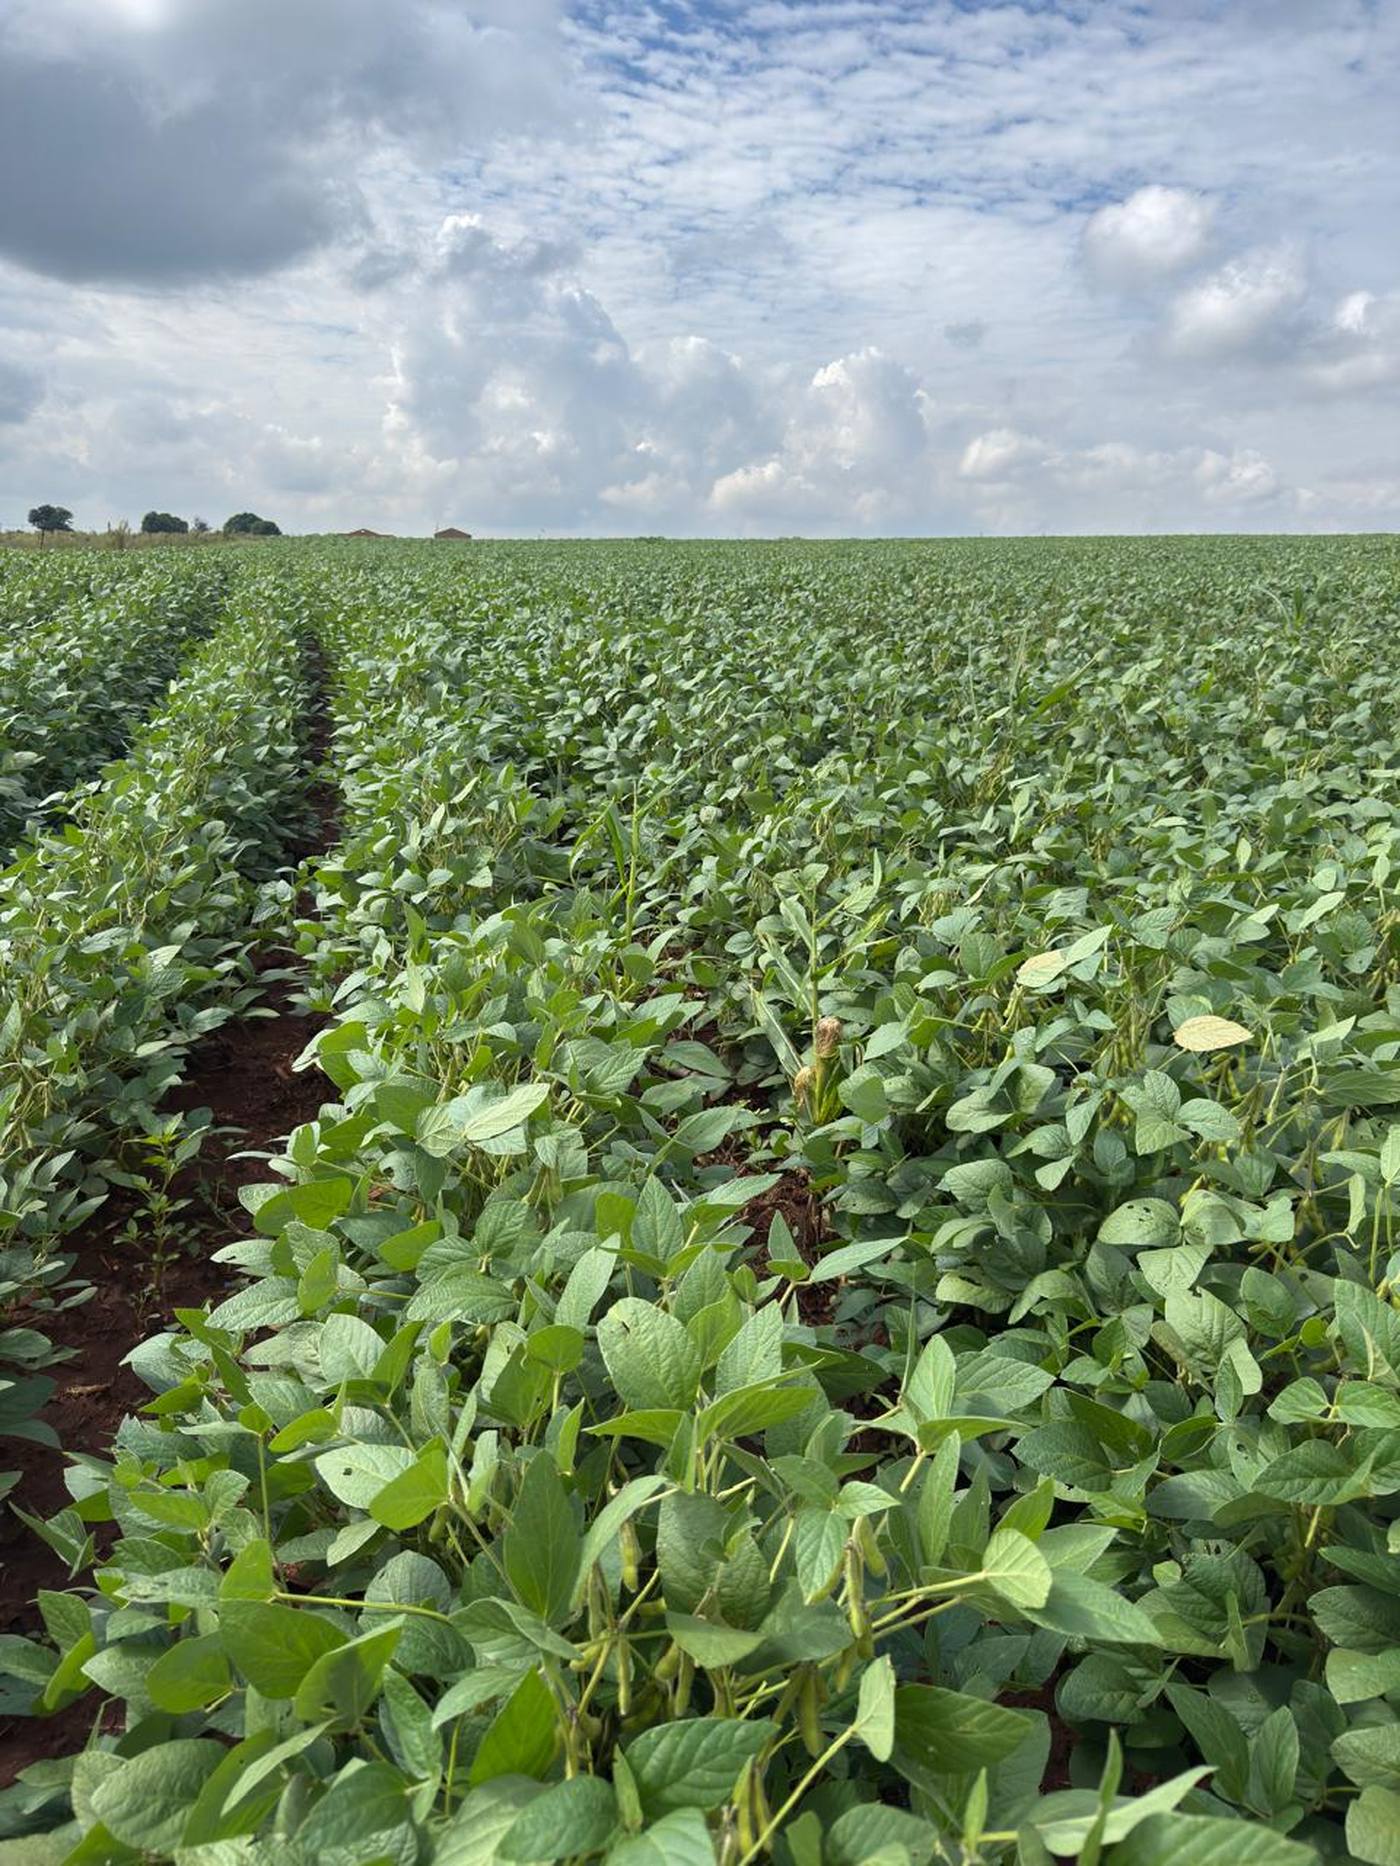
Mpumalanga’s Highveld produces more than half of South Africa’s entire soybean crop.
Mbombela is South Africa’s second-largest citrus-producing district.
…and everywhere in between — vineyards, pastures, lucerne and orchards across the country. Same drone, same precision, same detail.
Our Agronomy Partner
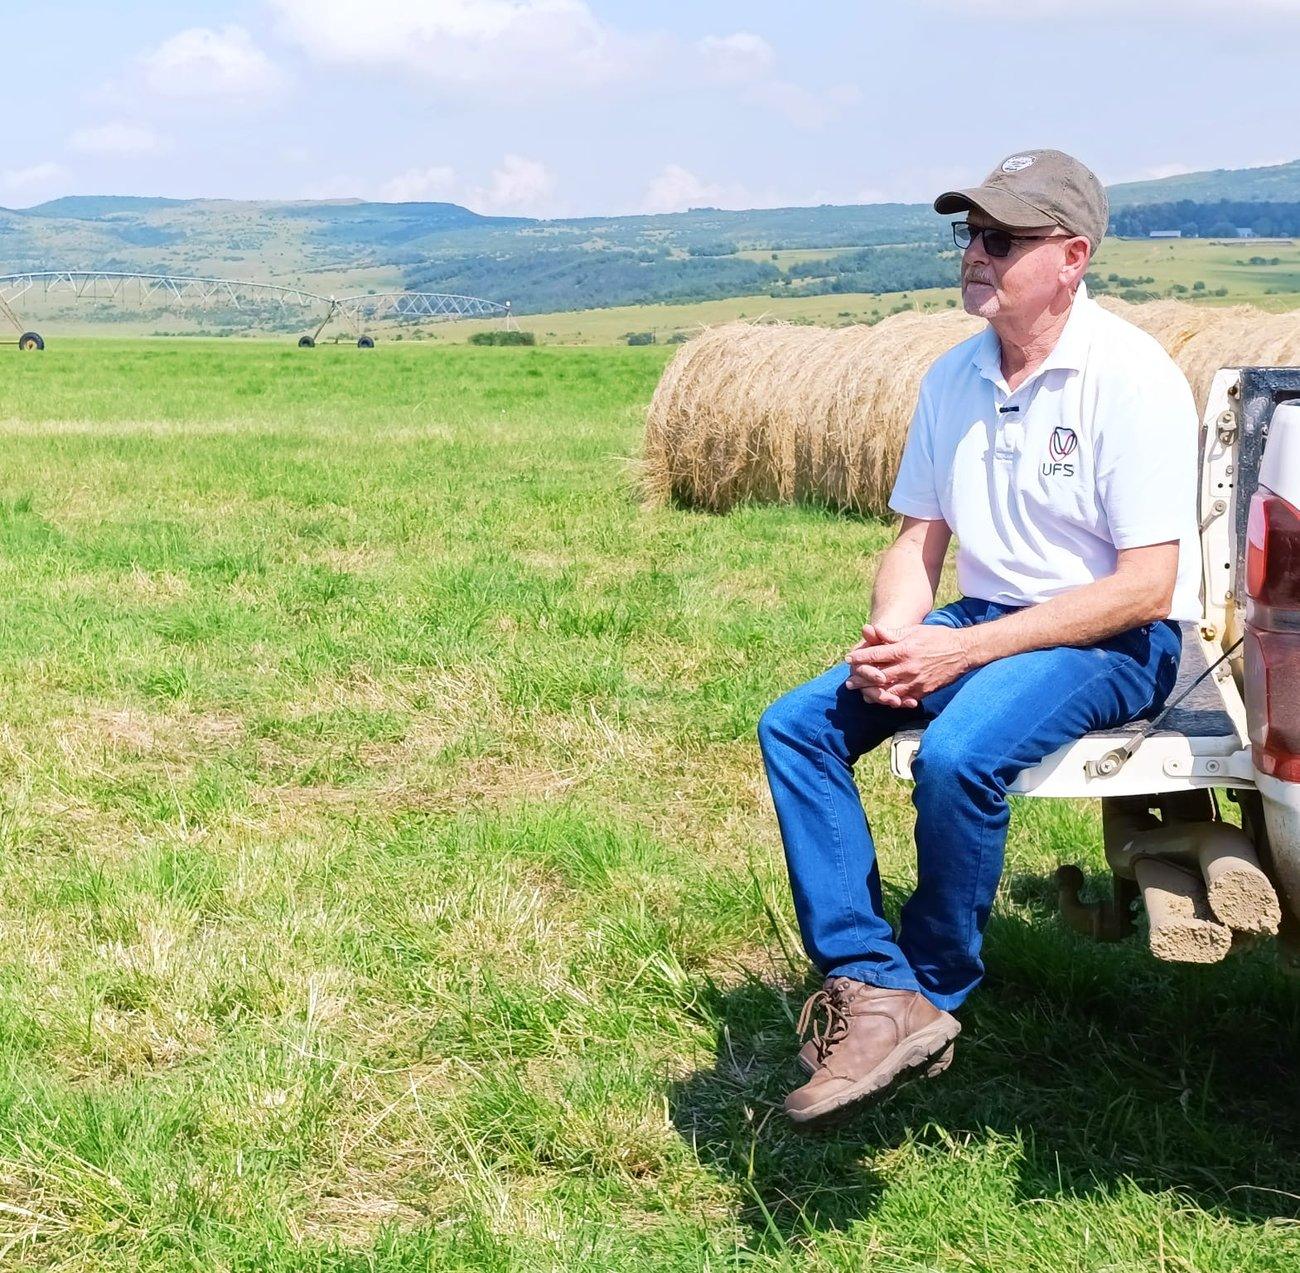 FieldOptix is partnered with the agronomists at Bruwer AgriScience — highly qualified specialists who keep your fields in sight at all times, checking every detail on the ground so best agronomic practice is followed from planting to harvest. Every map we fly is reviewed by people who know exactly what they’re looking at.

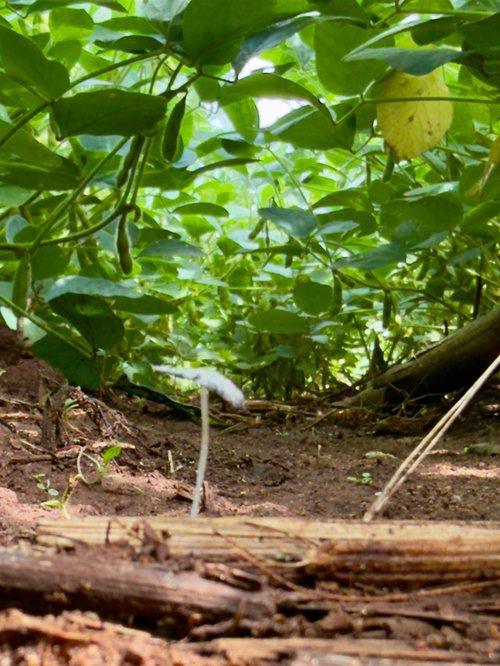
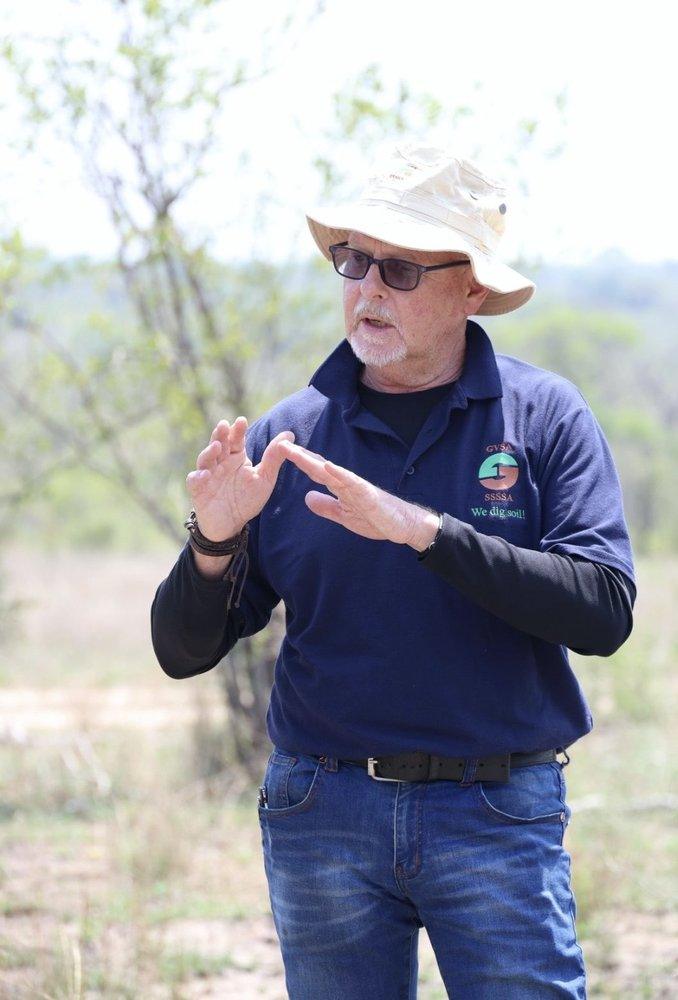
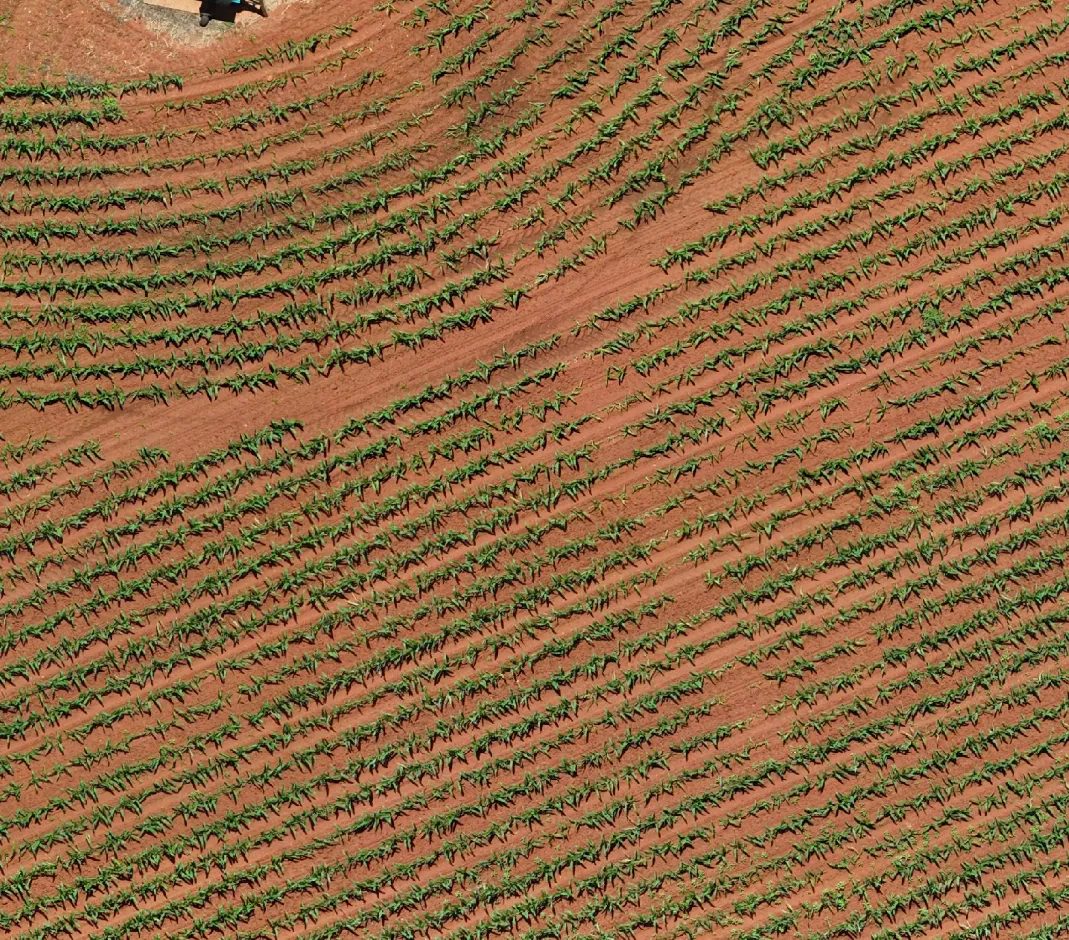
Every map starts on the ground, in fields like this one — not just behind a screen.
Not on a fixed weekly schedule — on your crop's own schedule. We fly at plant groundbreak, then again at each critical growth stage for that specific crop, timed using cultivar-level maturity data, since two cultivars of the same crop can reach the same stage weeks apart. The flight happens when the stage matters, not on a generic calendar.
Weed pressure, plant vigor, green snap after wind events, elevation and drainage stress, growth stage and seed-stand population — all classified and quantified from the same flight.
Resolution and coverage. We map at under a centimetre per pixel across 100% of the field — not a sampled estimate from a few hundred metres up.
No — we fly any crop planted in rows, blocks or pivots: grain and oilseed on the Highveld, orchards, cane and vegetables in the Lowveld, and everything in between.
Every flight is reviewed by the agronomists at Bruwer AgriScience alongside our own analysis, so what reaches you is a professional read of the field — not just a raw map.
High-resolution imagery of your whole field, first and foremost — then a wide range of AI analysis run on top of it. We also look at the raw pictures ourselves, to inspect every centimetre of the field by eye, not just by algorithm. From there, a recommendation follows if one's needed: a GPS-located problem area like the nozzle ring above, or a variable-rate spray, fertilizer or seeding map your equipment can run directly.
Contact us for a quote. Tell us about your farm and the fields you'd like flown, and we'll send you a price.
Seen From The Air