
Scientific Evidence
This isn’t a hunch. It’s published research.
Every capability on this site — the resolution, the AI classification, the stage-timed flight cadence, the growth-stage-aware prescriptions — is grounded in peer-reviewed remote-sensing research. Here it is in plain language, with real numbers and the sources linked, so you don’t have to take our word for it.
01 · Resolution
Why altitude changes what you can actually see.
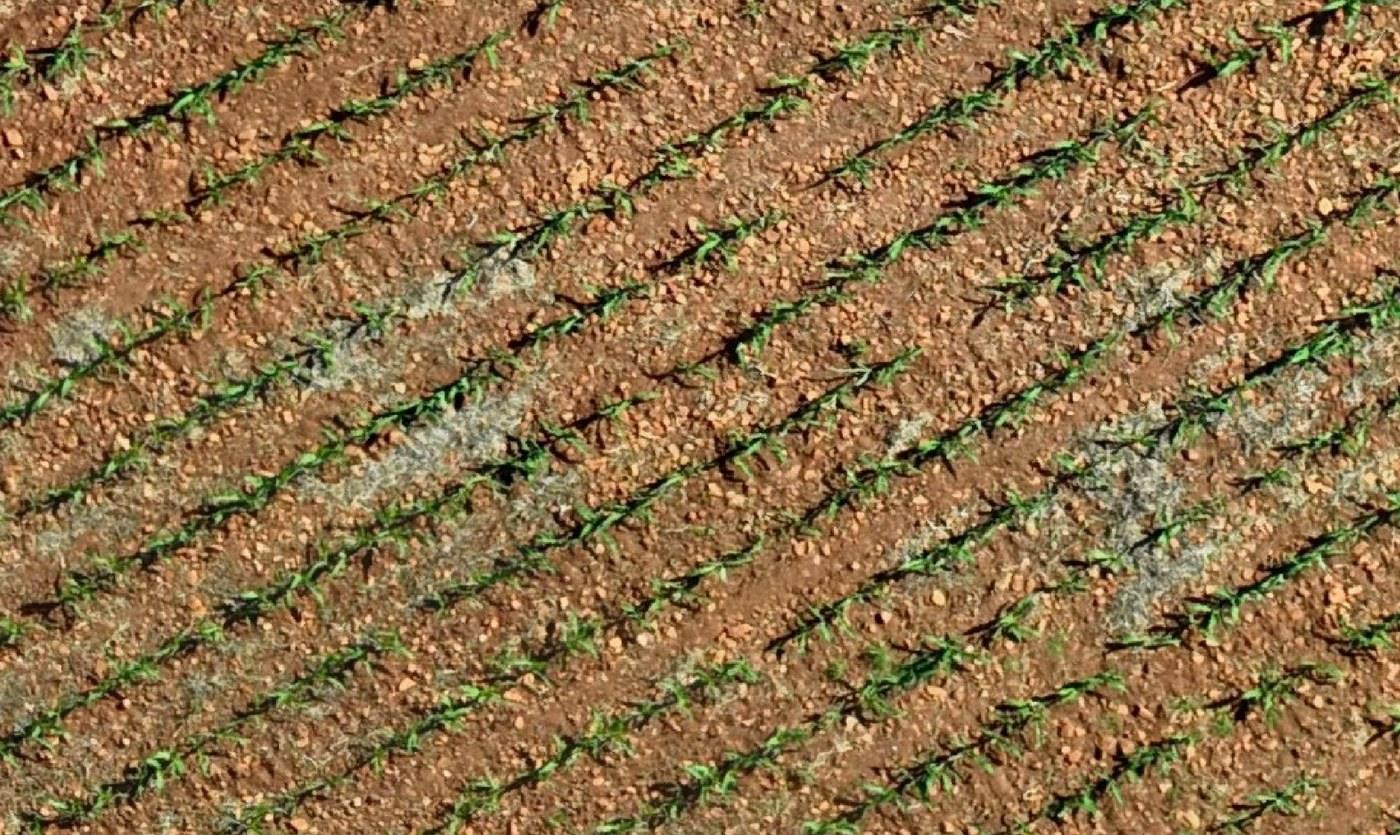
A satellite pixel and a drone pixel are not the same kind of thing. One is an average of everything inside several metres of ground; the other is a few centimetres. That difference is the whole story.
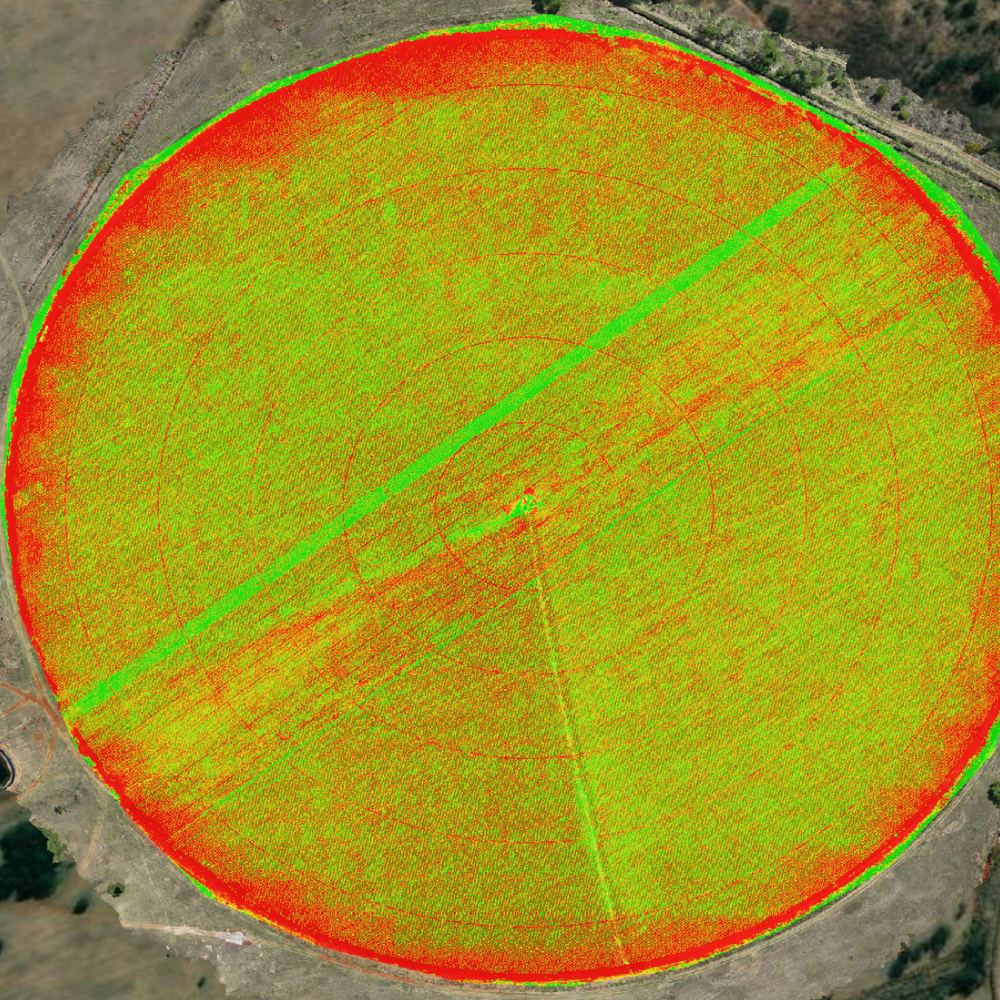
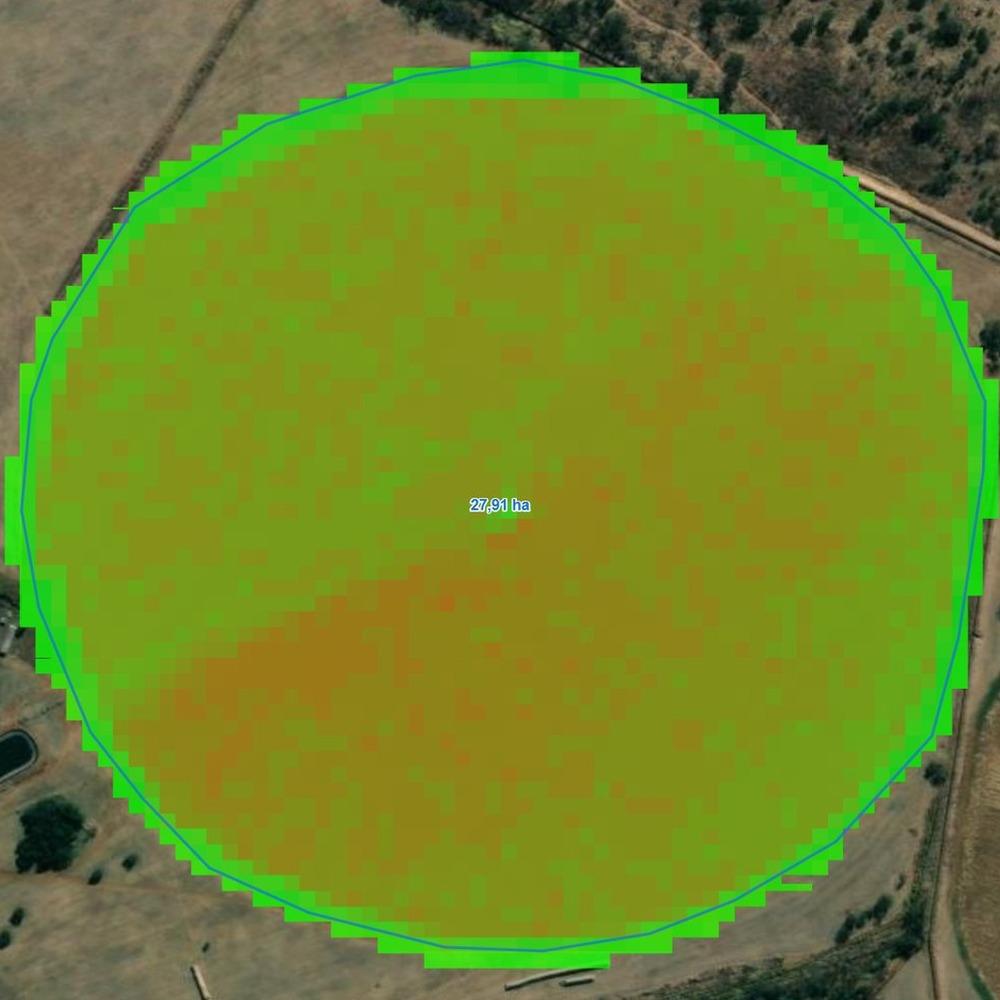
Quick definition, since it comes up throughout this page: NDVI (Normalized Difference Vegetation Index) compares how much near-infrared light a plant canopy reflects against how much red light it absorbs. Healthy, vigorous plants reflect far more near-infrared than stressed ones, which is what makes NDVI useful for drought monitoring, conservation research and crop assessment at every scale — from a single leaf to an entire continent — per NASA's own Earth-observation program.
Published crop-monitoring studies bear this out. Satellite products used in the research cited on this page run from 10 m per pixel (Sentinel-1 SAR, Sentinel-2 optical) up to 15 m (Landsat-8) and even 250 m (MODIS) — while the drone imagery in the same body of research runs 1.5 cm to 4.5 cm per pixel. One 2016 study comparing the two approaches put it plainly: UAVs collect imagery "with high spatial resolution (up to cm) and temporal frequency… at lower costs" than satellite-based monitoring.
The clearest evidence comes from a 2024 study that flew both a drone (2.5 cm/pixel) and Sentinel-2 (5 m, upsampled) over the same field on the same days. Early in the season the two platforms disagreed by roughly 0.1 NDVI — a real, measurable gap caused purely by resolution and viewing conditions, not by anything happening in the field.
02 · Beyond NDVI
For maize, height tells you what greenness can’t.
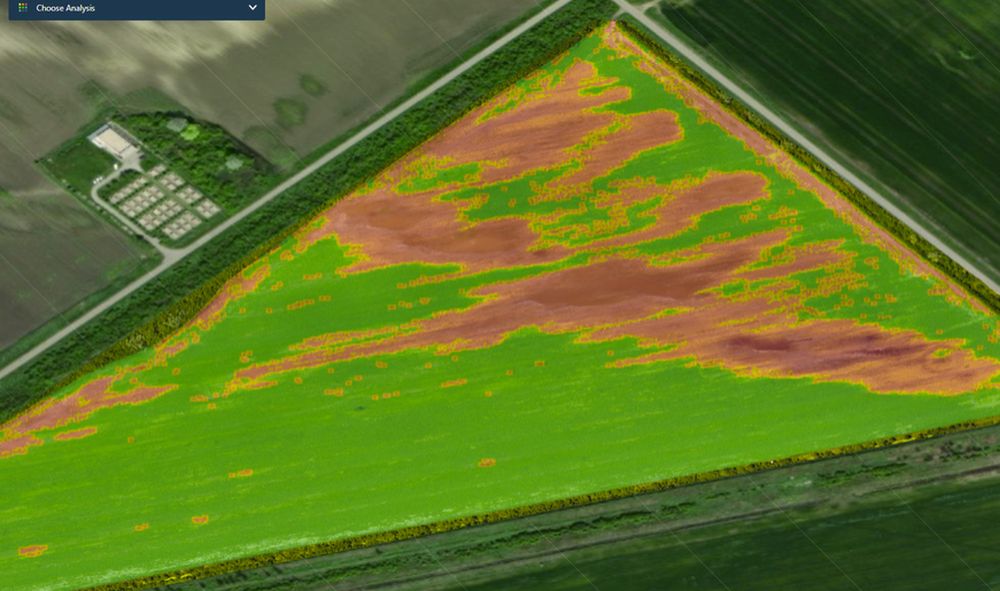
NDVI — the classic "how green is it" vegetation index — is useful, but two independent studies on maize damage (2023 and 2025) found it badly under-detects real damage: the best NDVI-only methods caught only 28–49% of true damaged area. A structural approach — measuring canopy height from drone imagery instead of just colour — caught 71–83% in the same fields.
The reason matters for any tall row crop: NDVI only works while the plant is green. Once maize dries down toward maturity, index-based methods lose their signal entirely across the whole field. A height-based structural model, built from the same drone flight, keeps working right through to harvest — which is why FieldOptix reads canopy structure alongside vigor, not vigor alone.
A separate 2025 study using wild-boar damage as a stand-in for storm and wind damage found the drone-derived terrain model agreed with an official government LiDAR survey on which areas were damaged with a Jaccard similarity of 0.90–0.92 — independent confirmation that structural analysis from a consumer drone holds up against professional-grade ground truth.
03 · AI you can verify
Classification accuracy, checked against real records — not just claimed.
The strongest test of an AI damage-detection model isn’t a lab benchmark. It’s whether it agrees with what actually happened on the ground, at scale.
A 2025 study built an attention-based segmentation model to map corn damage after a derecho windstorm tore through Illinois in June 2023. The model estimated 69,352 acres of damage; the USDA’s official post-event survey recorded 75,401.6 acres — a 91.98% agreement with government ground-truth data, at 93.39% overall pixel accuracy.
A second 2025 study classifying flood-damaged maize in China reached 96.32% overall accuracy with a maize-specific user accuracy of 95.8%, cross-validated against an independent follow-up survey of the same event.
We’d rather be precise than impressive here: these are the strongest published results in a field where accuracy genuinely varies by crop, growth stage and damage type — which is exactly why every FieldOptix map is still reviewed by the agronomists at Bruwer AgriScience before it reaches you, rather than shipped as a raw model output.
04 · Why timing matters
Damage has a visibility window — and it closes fast.
A 2016 study tracking hail damage in row crops found vegetation-index readings correlated strongly with damage severity within 10 days of the event (r = 0.77–0.90). By 20–35 days later, the crop had regrown enough that damaged and undamaged areas became spectrally indistinguishable — the signal was simply gone, even though the yield impact wasn’t.
That's not a small caveat. It means a badly-timed flight doesn't just see damage a little late — it can miss it completely. Hail alone cost US growers an estimated US$914.6 million in a single year (2014, USDA Risk Management Agency), and that's before wind, drainage stress or pest pressure. It's why we don't fly on a generic calendar: flights are timed to plant groundbreak and then to each crop's own critical growth stages — using cultivar-level maturity data, since two cultivars of the same crop can reach the same stage weeks apart — so a flight lands inside that visibility window instead of after it's already closed.
05 · From detection to yield
The link between what we see and what you harvest is measured, not assumed.
A 2020 study validated a vegetation-damage index against real yield outcomes on 37 field plots. Every single one of the 23 plots flagged as damaged — 100% — had a measured yield loss. Across three separate flood disasters, the index correlated with percentage yield loss at R² = 0.54 — a real, if imperfect, statistical link between what a flight detects and what ends up in the bin.
That link isn't unique to maize, either. A 2019 study flew small UAVs — DJI Phantom 4s carrying compact multispectral sensors — over 120 rice and wheat fields spanning 77.5 ha, at a ground-sample distance around 10.5 cm. The resulting NDVI maps reliably separated different fertiliser application levels in both crops, and correlated with final wheat yield at R² = 0.601–0.809 from the middle reproductive stage through early ripening. The same pattern this page describes for maize — that fine resolution and flight timing both matter, and that a single seasonal snapshot isn't enough — holds up in entirely different crops and growing regions.
Closer to home, researchers at the University of Fort Hare, the Agricultural Research Council, the University of Pretoria and the University of the Free State built a maize-specific agronomic risk model for smallholder farmers in the Eastern Cape. Using FAO crop-water data, they weighted the mid-season stage — tasseling, silking and pollination — at 64% of total agronomic importance, because it's the single most water-critical point in a maize plant's life. It's a peer-reviewed, South African precedent for exactly what FieldOptix's growth-stage tracking is built to do: treat different weeks of the season as genuinely different in risk, not just different in appearance.
References
The sources, in full.
- Zhou, Z., Pavek, M.J., Shelton, S.C., Holden, Z.J., & Sankaran, S. (2016). Aerial multispectral imaging for crop hail damage assessment in potato. Computers and Electronics in Agriculture, 127, 406–412. doi.org/10.1016/j.compag.2016.06.019
- Rahman, M.S., Di, L., Yu, E., Lin, L., Zhang, C., & Tang, J. (2020). Remote sensing based rapid assessment of flood crop damage using novel disaster vegetation damage index. International Journal of Disaster Risk Science, 12, 90–110. doi.org/10.1007/s13753-020-00305-7
- Wu, Li, Wang, Wei, Chen, & Tu (2025). Remote sensing-based agricultural damage assessment: a semantic segmentation method for analyzing corn field changes. Proceedings of CNML 2025. doi.org/10.1145/3728199.3728265
- Qamer, F.M. et al. (2023). A framework for multi-sensor satellite data to evaluate crop production losses: the case study of 2022 Pakistan floods. Scientific Reports, 13, 4240. doi.org/10.1038/s41598-023-30347-y
- Dobosz, B., Gozdowski, D., Koronczok, J., Žukovskis, J., & Wójcik-Gront, E. (2023). Evaluation of maize crop damage using UAV-based RGB and multispectral imagery. Agriculture, 13(8), 1627. doi.org/10.3390/agriculture13081627
- Hlavňa, P. & Bachan, M. (2025). Evaluating mechanically-caused crop damage using two simple UAV-based assessment techniques. The International Archives of the Photogrammetry, Remote Sensing and Spatial Information Sciences, XLVIII-5/W3-2025. doi.org/10.5194/isprs-archives-XLVIII-5-W3-2025-35-2025
- Masiza, W., Chirima, J.G., Hamandawana, H., Kalumba, A.M., & Magagula, H.B. (2022). A proposed satellite-based crop insurance system for smallholder maize farming. Remote Sensing, 14(6), 1512. doi.org/10.3390/rs14061512
- Wen, Sun, Li, Han, Gunasekera, Chen, Zhang, & Zhao (2025). Flood mapping and assessment of crop damage based on multi-source remote sensing: a case study of the "7.27" rainstorm in Hebei Province, China. Remote Sensing, 17(5), 904. doi.org/10.3390/rs17050904
- Gati, B. (2024). Comparison of vegetation indices obtained by drone and satellite. E3S Web of Conferences, 590, 01008. e3s-conferences.org
- Guan, S., Fukami, K., Matsunaka, H., Okami, M., Tanaka, R., Nakano, H., Sakai, T., Nakano, K., Ohdan, H., & Takahashi, K. (2019). Assessing correlation of high-resolution NDVI with fertilizer application level and yield of rice and wheat crops using small UAVs. Remote Sensing, 11(2), 112. doi.org/10.3390/rs11020112
- Further reading (agency resource, not a peer-reviewed study): NASA Earthdata. Normalized Difference Vegetation Index (NDVI). earthdata.nasa.gov
Want to see what this looks like on your fields?
Same science, applied to your hectares, timed to what they're actually doing.